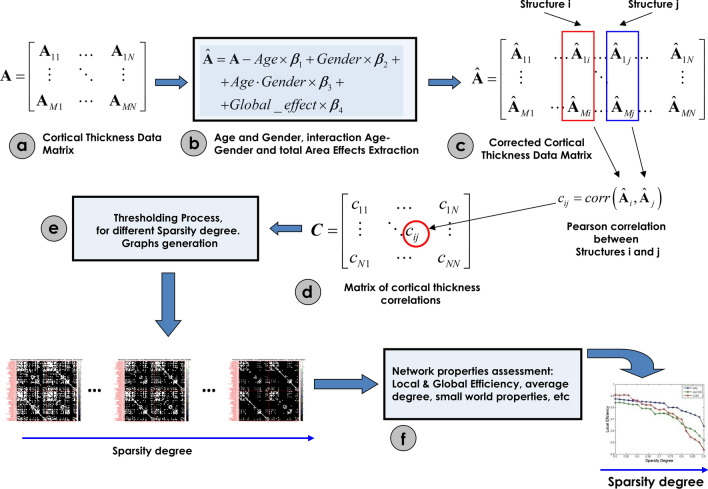
Figure 2.
Steps for assessing the networks of cortical thickness covariance. (a) Matrix of the morphometric descriptor (cortical thickness) for the Destrieux parcellation. (b) The data matrix was substituted by residuals of the linear regression to subtract effects of age, gender, interaction age–gender, and the global effect (global mean cortical thickness) represented in (c). (d) Correlation matrix representing the concurrent changes among all pairs of anatomical structures. (e) The thresholding process for different sparsity levels to generate binary graphs. (f) Assessment of the network properties for all binary graphs obtained in (e).

