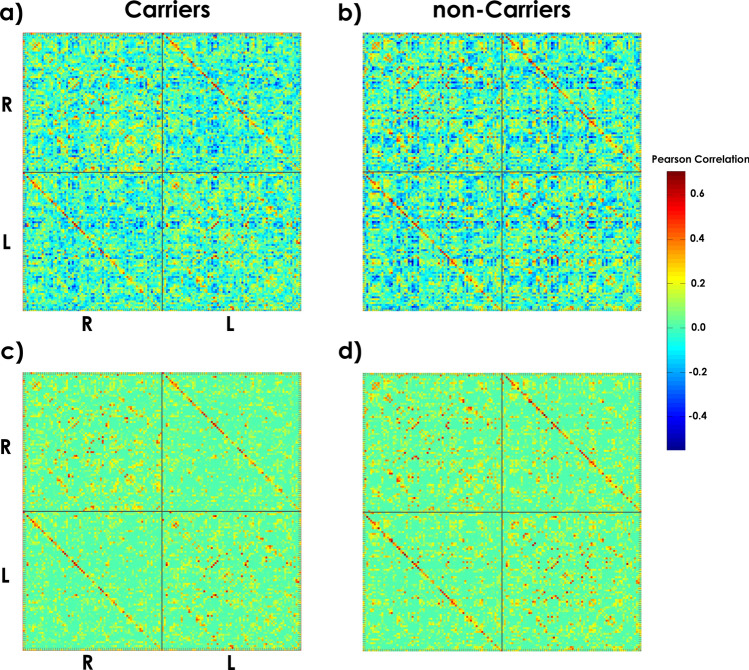
Figure 3.
Cortical thickness correlation matrices for each group. (a) and (b) display matrices with positive and negative correlation values. (c) and (d) represent matrices with positive correlation values. The strength of the connection is indicated by the color bar. The 'R-'R' and 'L-'L' quadrants represent the intra-hemispheric cortical thickness correlations in the right and left hemispheres. The 'R-'L' and 'L-'R' quadrants depict the inter-hemispheric interactions. The diagonal of the 'L'-'R' quadrant shows the correlations in cortical thickness between homologous structures across hemispheres.

