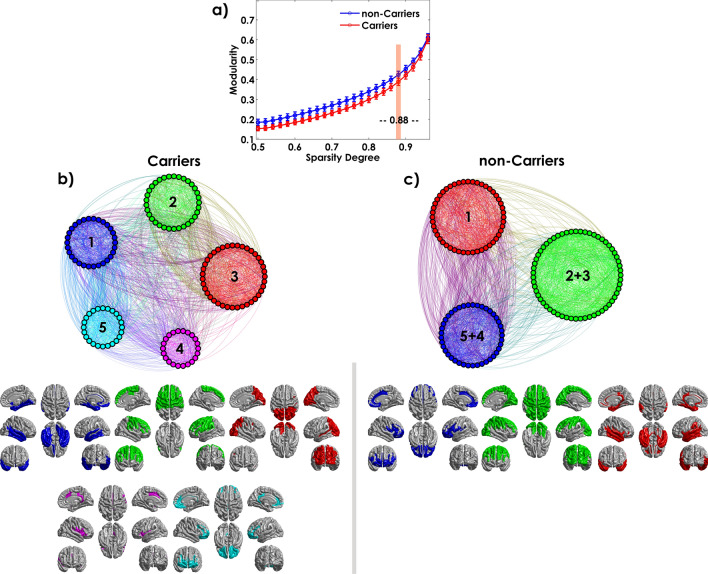
Figure 8.
Module distributions for both Carriers and non-Carriers groups estimated using Newman's spectral community detection algorithm at sparsity degree 0.88. The circular representation of the modules was based on the Gephi package (https://gephi.org/). Inferior panels show the cortical surface mapping of the modules in both Carriers and non-Carriers groups using the BrainNet Viewer package (http://www.nitrc.org/projects/bnv). Each color represents those regions that belong to a specific module.

