Figure 3.
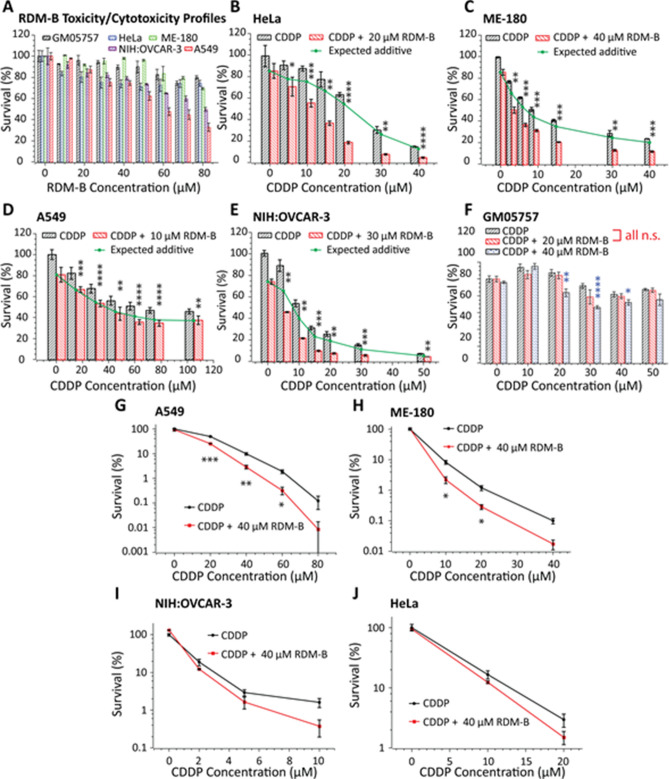
In vitro cell viability tests on various human cancer cell lines and a normal cell line. All viabilities are represented as percentages with respect to the control (untreated cells, taken as 100% survival). The MTT assay was performed to obtain RDM-B (BV10) cytotoxicity and toxicity profiles (A), cell-killing efficacies of CDDP and its combination with BV10 in cervical cancer HeLa cells (B) and ME-180 cells (C), lung cancer A549 cells (D), ovarian cancer NIH:OVCAR-3 cells (E), and normal cells (F), in which error bars represent the standard deviation of data obtained in each group. All MTT experiments were performed at 24 h post-treatment. The clonogenic assay was performed in A549 (G), ME-180 (H), NIH:OVCAR-3 (I), and HeLa (J) cells for 2 h treatment with CDDP and its combination with BV10, in which error bars represent the standard error of the mean (s.e.m.) of data obtained in each group. The p values reported on the graph were obtained from unpaired two-tail student t tests: ****, p < 0.0001; ***, p < 0.001; **, p < 0.01; *, p < 0.05; n.s., nonsignificant (p ≥ 0.05).

