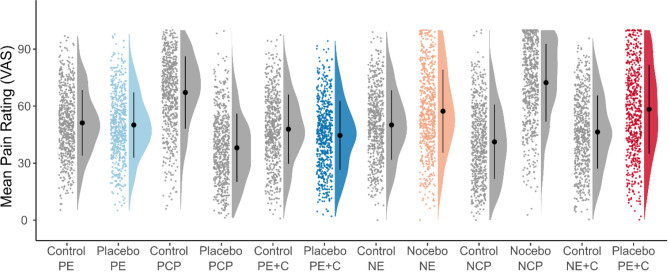
Figure 1.
Mean pain rating per condition. The dots represent mean data (average of 8 trials) of individual participants. The half-violin plots represent the distribution of the data. The black dot represents the group mean and the error bars represent the standard deviation. The following conditions are displayed: Control condition rating Placebo Expectation (Control PE), placebo condition rating Placebo Expectation (Placebo PE), control condition rating Placebo Conditioning Procedure (Control PCP), placebo condition rating Placebo Conditioning Procedure (Placebo PCP), control condition rating Placebo Expectation plus Conditioning (Control PE + C), placebo condition rating Placebo Expectation plus Conditioning (Placebo PE + C), control condition rating Nocebo Expectation (Control NE), nocebo condition rating Nocebo Expectation (Nocebo NE), control condition rating Nocebo Conditioning Procedure (Control NCP), nocebo condition rating Nocebo Conditioning Procedure (Nocebo NCP), control condition rating Nocebo Expectation plus Conditioning (Control NE + C), nocebo condition rating Nocebo Expectation plus Conditioning (Nocebo NE + C). The sham treatment conditions used for calculation of the mean rating (against the respective control conditions) are displayed in color. In all conditions, participants were exposed to VAS60 stimuli with the exception to the conditioning procedure. In the control condition of the Placebo Conditioning Procedure and the nocebo condition of the Nocebo Conditioning Procedure, the participant was exposed to VAS80 stimuli, while in the placebo condition of the Placebo Conditioning Procedure and the control condition of the Nocebo Conditioning Procedure the participants were exposed to VAS40 stimuli.

