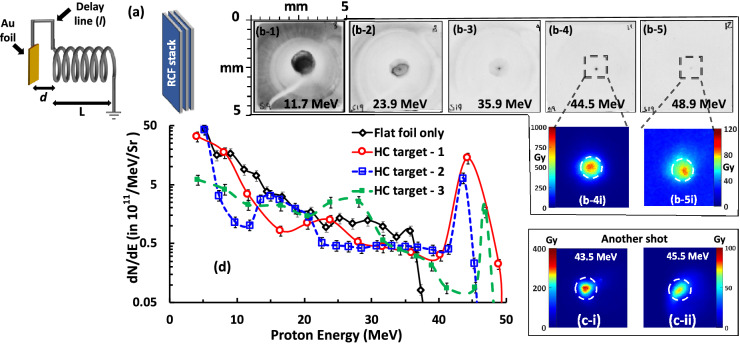
Figure 1.
(a) Schematic of the setup (not to scale) used in the experiment. The HCs were made of 0.125 mm thick stainless steel wire and had pitch, internal diameter and length of , and respectively. The HC was placed at from a gold (Au) foil and connected to the foil by a delay line of length . The Radiochromic films (RCF) stack detector was placed at from the interaction foil. Proton beam footprints captured by different RCF layers in the stack, corresponding to different proton energies, are shown in (b-1) - (b-5). The scale shown at the top right corner of (b-3) refers to the RCF plane. Zoomed-in views of the dose profiles for the high energy pencil beams are shown in (b-4i), (b-5i), (c-i) and (c-ii), where the last two snapshots are obtained from a second shot during the campaign using very similar laser and target parameters. The white-dashed circles on the zoomed-in views corresponds to the internal diameter of the HC. (d) shows the comparison between a typical proton spectrum obtained from reference flat foil targets and three HC target shots, RCF images from two of which (labelled as HC target-1 and HC target-2, respectively) are shown in (b,c). The spectrum labelled as HC target-3 was obtained from a shot taken at similar interaction conditions, using a HC target syncing similar energy protons (30 MeV) as in case of (b,c) with an internal diameter and pitch of and respectively. The on-axis proton spectra were obtained from the RCF data, as described in refs.22,28, considering the proton dose from the area enclosed by the black-dashed circles in the zoomed-in RCF views, corresponding to half angle divergence (). The error bars were estimated considering the error in dose conversion22 and uncertainties in background subtraction.

