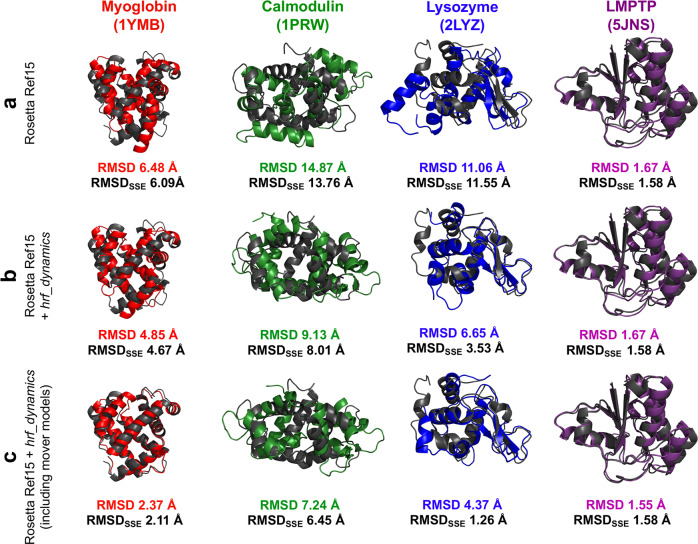
Fig. 3. Crystal structures (dark gray) of benchmark proteins aligned with best scoring model predictions (color).
RMSD and RMSD over SSEs (RMSDSSE) are listed. Structure visualization was accomplished in PyMOL. Myoglobin models are shown in red, calmodulin in green, lysozyme in blue, and LMPTP in purple. a Best scoring model based on scoring with Rosetta Ref15. b Best scoring model based on scoring with Rosetta Ref15 + hrf_dynamics. c Best scoring model including mover models scored with Rosetta Ref15 + hrf_dynamics.

