
Fig. 1.
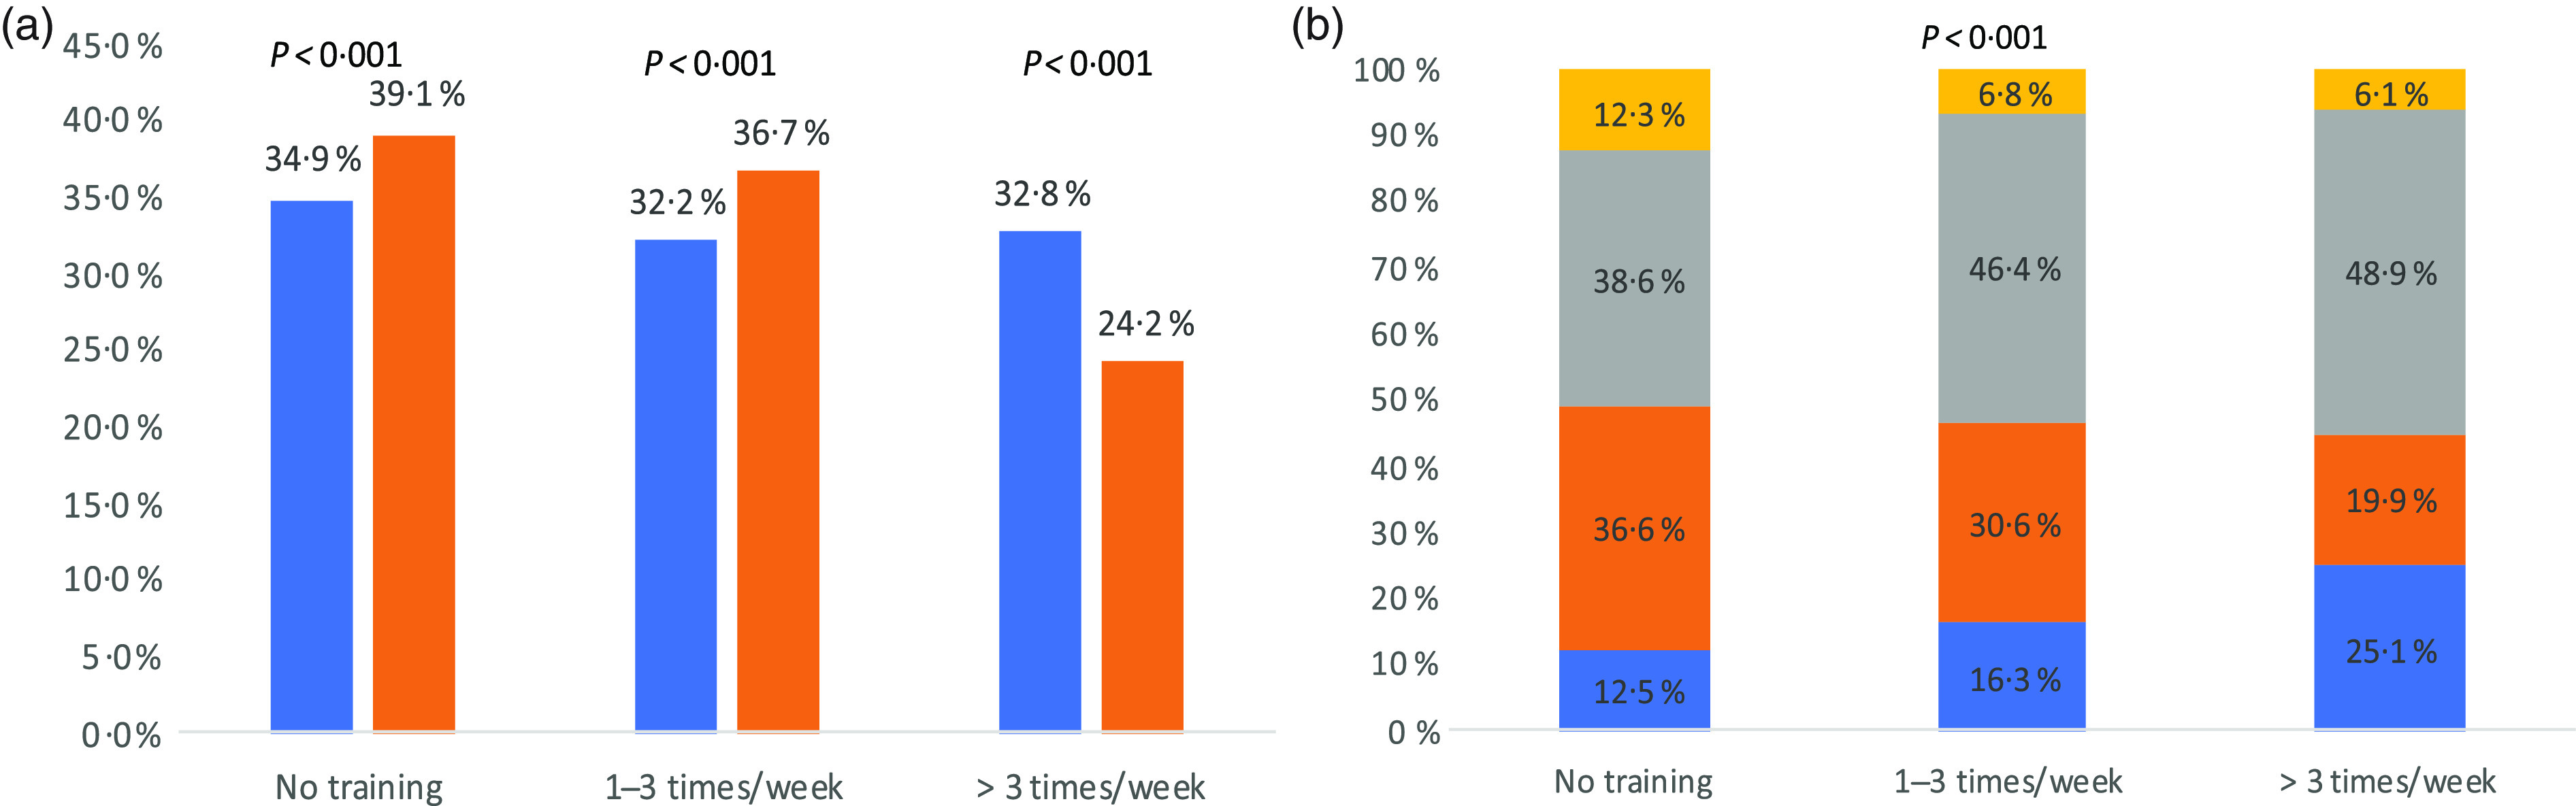
(a) Physical activity pre- and during coronavirus disease 2019 (COVID-19) pandemic (P values represent significance levels of McNemar’s test).  , Pre-COVID-19;
  , during COVID-19. (b) Physical activity during COVID-19 pandemic and change in weight (P values represent significance levels of χ
2 test). , Lost weight; , gained weight;
, during COVID-19. (b) Physical activity during COVID-19 pandemic and change in weight (P values represent significance levels of χ
2 test). , Lost weight; , gained weight;  , maintained weight;
  , I do not know.