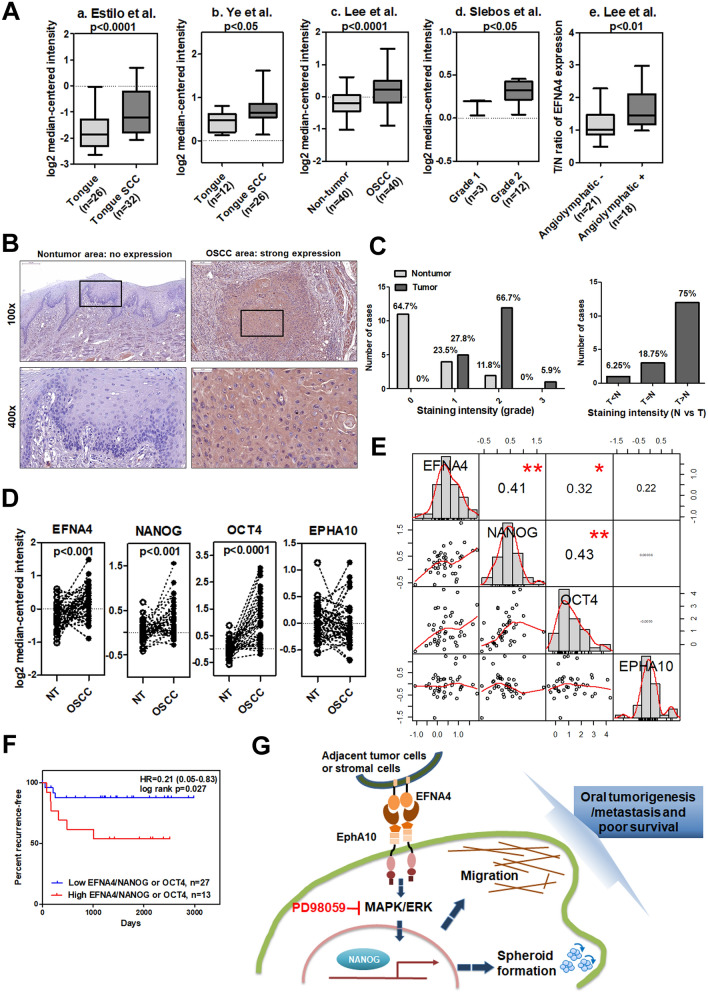
Figure 6.
Co-expression of EFNA4 with NANOG and OCT4 mRNA in OSCC. (A) Increased EFNA4 mRNA expression in OSCC tissues compared to normal oral tissues or nontumor areas via clinical dataset analysis (a–c). Increased EFNA4 mRNA expression in OSCC of higher tumor grade or angiolymphatic invasion via clinical dataset analysis (d–e). The relative EFNA4 mRNA expression is represented by log2 median-centered intensity in datasets a–d. The average tumor/nontumor (T/N) ratio of EFNA4 mRNA is shown in dataset e. (B) Immunohistochemical analysis of EFNA4 in human OSCC samples. No expression or weak EFNA4 expression in the nontumor epithelium (left panel) and strong EFNA4 staining in the OSCC areas is visible at 100 × (scale bar, 200 μm) and 400 × (scale bar, 50 μm) magnifications. (C) Left: Scoring of EFNA4 staining intensity in 17 noncancerous epithelium samples (light grey bars) and 18 tumor samples (dark grey bars). Expression levels are scored as: 0, none; 1, weak; 2, moderate; 3, strong. Right: Comparison of the EFNA4 staining intensity between tumor areas (T) and noncancerous epithelium (N) based on each histological section. (D) EFNA4, NANOG, OCT4, and EPHA10 mRNA expression in OSCC tissues (n = 40) and corresponding nontumor (NT) tissues (n = 40). Data were obtained from clinical dataset GSE37991. The expression is represented by log2 median-centered intensity. (E) Correlations between the T/N ratios of EFNA4, EPHA10, NANOG, and OCT4 mRNA using the GSE37991 dataset and Pearson correlation analysis. Pearson's correlation coefficient (r) between two variants is shown in the center of the box at the intersect of each pair (n = 40). (F) Recurrence-free survival analysis with EFNA4, NANOG, and OCT4 mRNA expression as classification criteria using dataset GSE37991. Patients were stratified into low (EFNA4low/NANOGlow or EFNA4low/OCT4low, n = 23) and high (EFNA4high/NANOGhigh or EFNA4high/OCT4high, n = 17) groups using the median expression level of each mRNA as the cutoff. (G) The role of ephrin A4 (EFNA4)-ephrin receptor A10 (EPHA10) forward signaling in promoting OSCC tumorigenesis and metastasis. EFNA4 from adjacent tumor cells or stromal cells binds to EPHA10 on OSCC cells and induces extracellular signal-regulated kinase (ERK) activation. ERK activation drives progressive effects, including cell migration and spheroid formation, and up-regulation of NANOG expression. NANOG is required for EFNA4-induced cell migration and sphere formation (indicated as dark blue dashed arrows). Bars represent SE; *p < 0.05; **p < 0.01.

