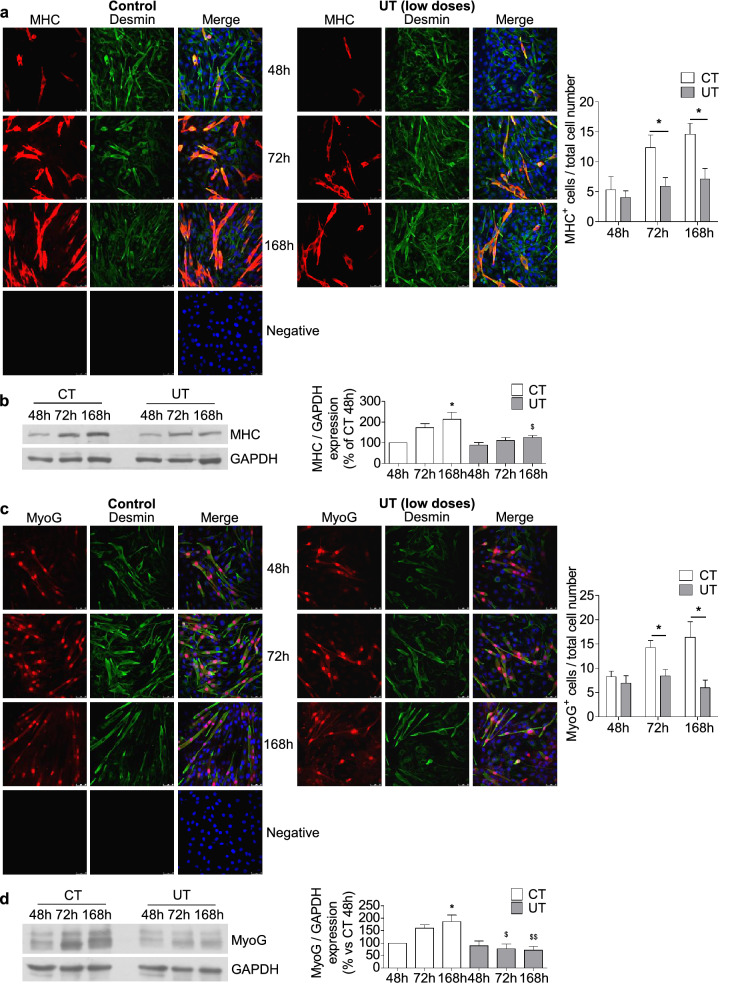
Figure 5.
Low doses of UT impaired the myogenic differentiation of murine cultured myoblasts by diminishing MyoG expression. C2C12 cells grew with 2% horse serum for 48, 72, and 168 h to allow myogenic differentiation in the presence of a mixture of 25 µg/mL IS and 10 µg/mL PC (UT) or vehicle (CT). (a) Myosin heavy chain (MHC, red) and desmin (green) were evaluated through immunofluorescence using a confocal microscope. A typical experiment is shown in the left panel. Negative staining control is shown. Bar graph shows the mean ± SEM of MHC-positive cells, from nine experiments (right panel). *p < 0.05 versus CT at the same time. (b) MHC expression was measured by western blotting. A typical blot is shown. Full-length blot is presented in Supplementary Figure S3. The densitometric analysis of the bands is represented in bar graph. Results are the percentage respect to control and are the mean ± SEM from ten experiments. *p < 0.05 versus CT 48 h. $p < 0.05 versus CT 168 h. (c) Myogenin (MyoG, red) and desmin (green) were determined by immunofluorescence and confocal microscopy. A typical experiment is shown in the left panel. Negative staining control is shown. The bar graph shows the mean ± SEM of MyoG-positive cells, from 10 experiments (right panel). *p < 0.05 versus CT at the same time. (d) MyoG expression was quantified by western blotting. A typical blot is shown. Full-length blot is presented in Supplementary Figure S3. The bar graph shows the densitometric analysis of the bands. Results are the percentage of control 48 h and are the mean ± SEM from six experiments. *p < 0.05 versus CT 48 h. $p < 0.05 versus CT 72 h. $$p < 0.05 versus CT 168 h.

