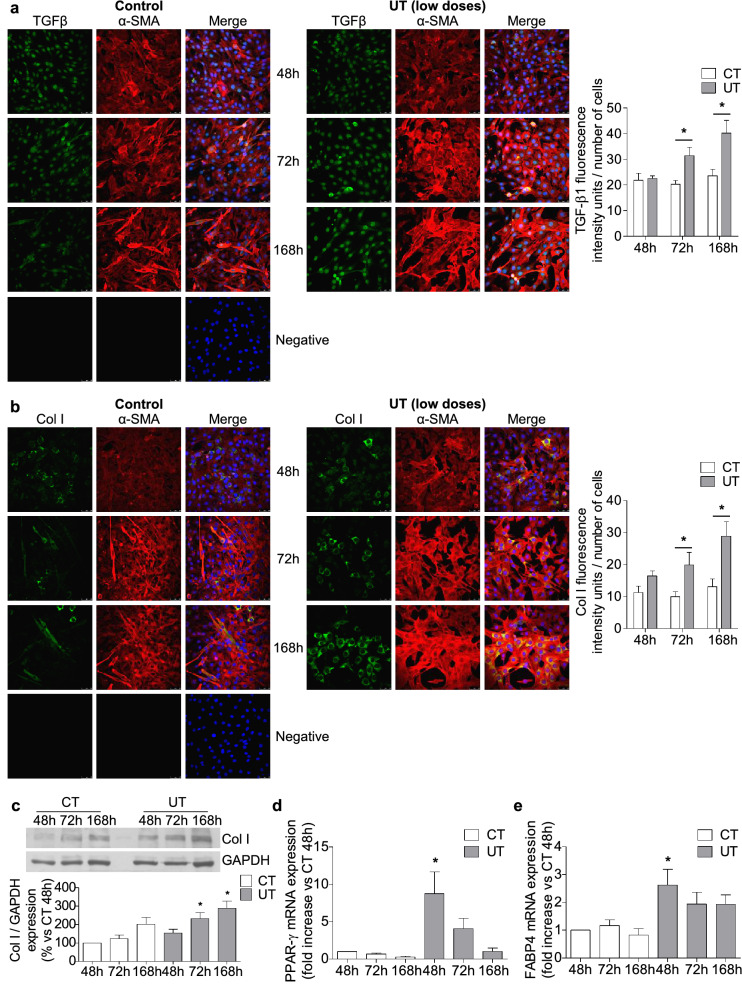
Figure 6.
Low doses of UT promoted fibrogenic and adipogenic differentiation in murine cultured myoblast. C2C12 grew with 2% horse serum for 48, 72, and 168 h to allow myogenic differentiation in the presence of a mixture of 25 µg/mL IS and 10 µg/mL PC (UT) or vehicle (CT). (a) TGF-β1 (green) and α-Smooth muscle actin (α-SMA, red) expression were analysed by immunofluorescence using a confocal microscope. A typical experiment is shown in the left panel. Negative staining control is shown. The bar graph shows the analysis of the intensity of green fluorescence (TGF-β1) corrected by the number of cells. Results, expressed as arbitrary fluorescence intensity units, are the mean ± SEM from ten different experiments. *p < 0.05 versus CT at the same time. (b) Collagen I expression (Col I, green) and α-SMA (red) were analysed by immunofluorescence using a confocal microscope. A typical experiment is shown in the left panel. Negative staining control is shown. The bar graph represents the densitometric analysis of the green fluorescence (Col I) corrected by the number of cells. Results are expressed as arbitrary fluorescence intensity units and are the mean ± SEM from ten different experiments. *p < 0.05 versus CT at the same time. (c) Col I protein expression was quantified by western blotting. A typical blot is shown. Full-length blot is presented in Supplementary Figure S3. The bar graph shows the densitometric analysis of the bands. Results are percentage of control 48 h and are the mean ± SEM from nine experiments. *p < 0.05 versus CT 48 h. (d) PPAR-γ mRNA expression was analysed by RT-PCR. Results are mean ± SEM from four experiments. *p < 0.05 versus CT 48 h. (e) FABP4 mRNA expression was analysed by RT-PCR. Results are mean ± SEM from four experiments. *p < 0.05 versus CT 48 h.

