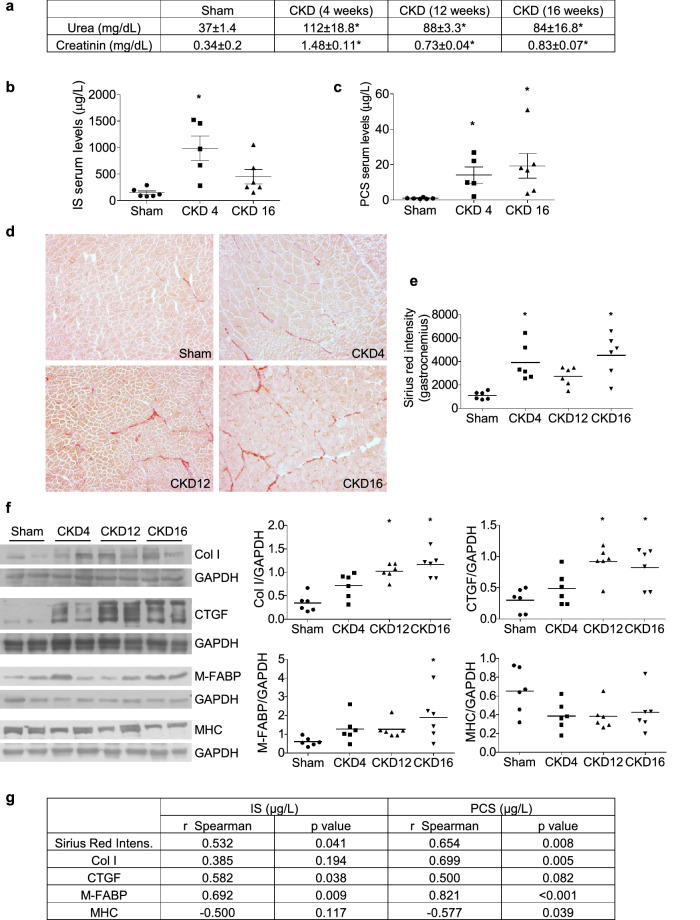
Figure 7.
Uraemic rats show a higher rate of fibrosis and adiposis in gastrocnemius muscles. Seven/eight nephrectomised (CKD) or sham operated (Sham) rats were euthanised 4, 12, or 16 weeks after surgery, and gastrocnemii were isolated. (a) Urea and creatinine serum concentrations. Results are expressed as mean ± SEM from six animals per group. *p < 0.05 versus Sham. (b) Serum concentration of indoxyl sulphate (IS). *p < 0.05 versus Sham. (c) Serum concentration of p-cresyl sulphate (PCS). *p < 0.05 versus Sham. (d), (e) Sirius red staining of gastrocnemii is shown in the left panel. Graph represents the Sirius red intensity measured in six animals from each group by three different researchers. *p < 0.05 versus Sham. (f) Collagen I (Col I) and CTGF, Muscle FABP (M-FABP) and Myosin heavy chain (MHC) expression were analysed by western blotting. Typical blots are shown. Full-length blots are presented in Supplementary Figure S3. Graphs show the densitometric analysis of the bands from six animals from each group. *p < 0.05 versus Sham. (g) Spearman correlation coefficients, along with p-values, between serum concentrations of IS and PCS with fibrosis markers (Sirius red intensity, Col-I, CTGF), with an adiposis marker (M-FABP) and with a mature myotube marker (MHC).

