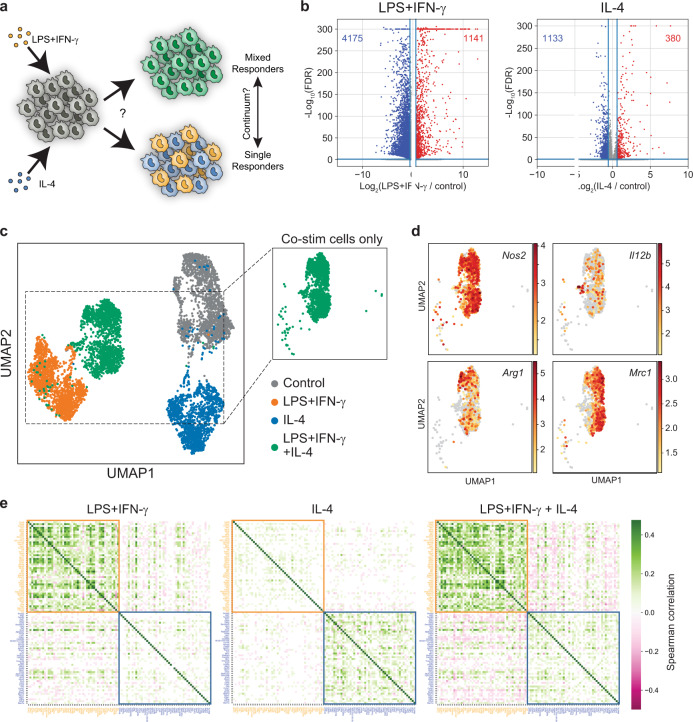
Fig. 1. Co-stimulation induces a global mixed gene expression program across individual macrophages.
a Schematic depicting how co-stimulation could lead to either mixed responses or specialized responses in individual macrophages. b Volcano plot of differential gene expression after stimulation for 6 h with 10 ng/ml LPS + 10 ng/ml IFN-γ (left) or 100 ng/ml IL-4 (right) relative to control. Genes significantly upregulated (red) and downregulated (blue) are identified by a change in expression ≥ 1.5-fold and a false discovery rate (FDR) < 0.05 relative to expression in the untreated condition. FDR calculated by a Wilcoxon rank-sum test with Benjamini–Hochberg correction. c, d UMAP visualization of single cells from all samples colored by treatment (c) or expression intensity for canonical markers of interest (d). Color bar indicates gene expression levels, shown as ln(transcript count + 1). e Heatmaps of Spearman correlations for the top 50 unique upregulated genes following stimulation with LPS+IFN-γ, IL-4, or both, within single cells from each treatment condition. The top 50 genes upregulated by LPS+IFN-γ or IL-4 are highlighted and boxed in yellow and blue, respectively. The color bar indicates the sign and magnitude of the correlation coefficient. The coefficients for gene pairs with a correlation p-value > 0.05 are set to 0.

