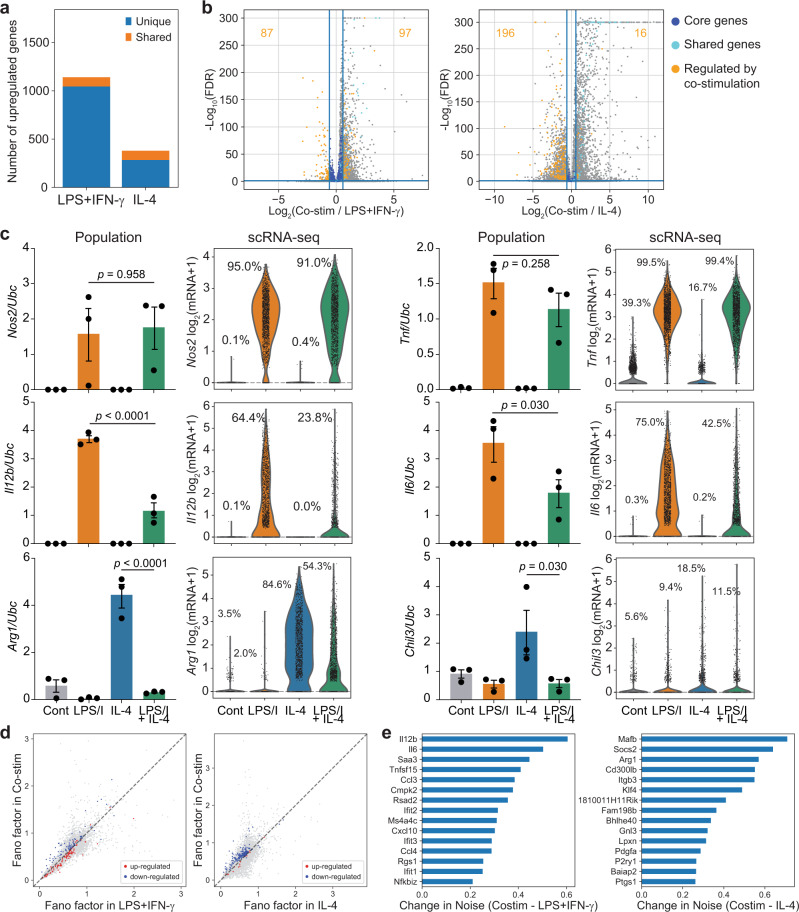
Fig. 2. Cross-inhibition of gene expression after co-stimulation is not uniform across single cells.
a Number of unique (blue) and shared (yellow) genes upregulated after stimulation (6 h, 10 ng/ml LPS + 10 ng/ml IFN-γ or 100 ng/ml IL-4). b Volcano plot of differential gene expression after co-stimulation (6 h, 10 ng/ml LPS + 10 ng/ml IFN-γ and 100 ng/ml IL-4) relative to LPS + IFN-γ alone (left) and IL-4 alone (right). Dark blue dots (see key) indicate the unique core genes (UCGs) selectively induced by LPS + IFN-γ or IL-4, respectively. Cyan dots indicate shared genes induced by both LPS + IFN-γ or IL-4. Yellow dots indicate UCGs modulated by co-stimulation, identified by an FDR ≤ 0.05 and change in expression ≥ 1.5-fold relative to expression after stimulation with LPS+IFN-γ or IL-4 alone. FDR determined as in Fig. 1. c Transcript levels for indicated targets in BMDMs after stimulation for 6 h with media alone, LPS+IFN-γ, IL-4, or both, measured by population RT-qPCR (left) and scRNA-seq (right). Population mRNA levels are presented relative to those of the control gene Ubc (mean ± SEM, n = 3 biological replicates). Two-sided one-way ANOVA with Sidak correction for multiple comparisons. Single-cell data is presented as the ln(transcript count +1) from a single experiment. d Noise in gene expression (calculated by Fano factor) across single cells stimulated with LPS+IFN-γ versus co-stimulated cells (left) or IL-4 vs co-stimulated cells (right) for genes negatively (blue) and positively (red) regulated by co-stimulation. e Change in cell-to-cell gene expression noise of LPS+IFN-γ-induced genes (left) and IL-4-induced genes (right) in co-stimulated cells relative to single stimulation. Source data are provided as a Source Data file.

