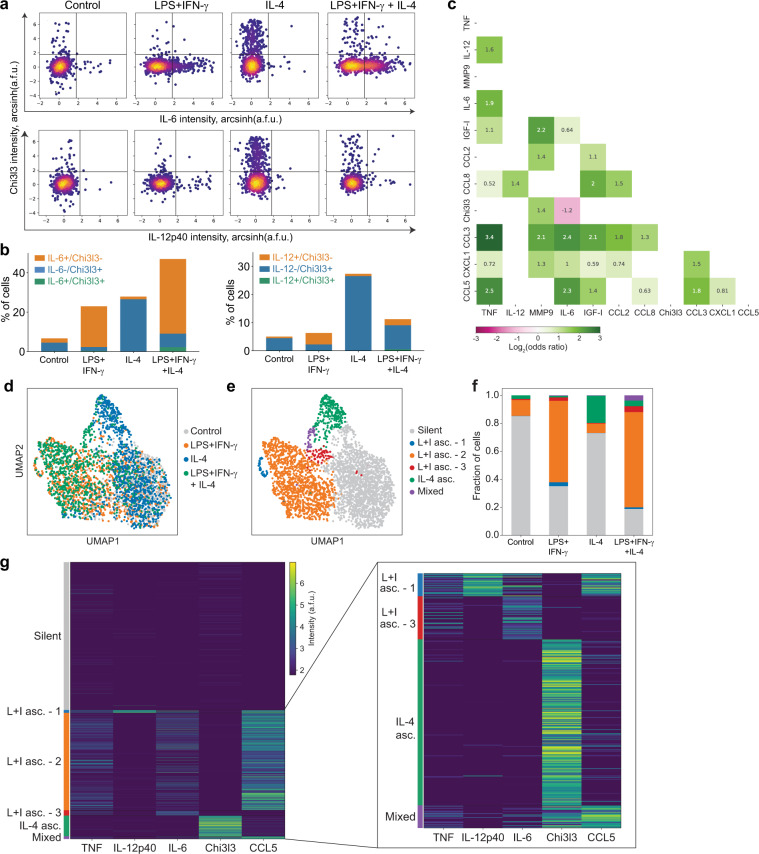
Fig. 5. Single-cell secretion assay identifies long-term specialization in co-stimulated cells.
A multiplexed single-cell secretion assay was used to measure cytokine/chemokine production in individual BMDMs stimulated for 48 h with media alone, 10 ng/ml LPS + 10 ng/ml IFN-γ, 100 ng/ml IL-4, or both. a Density scatter plots of single-cell secretion intensity (a.f.u.) across individual cells for Chi3l3 vs IL-6 (top) and Chi3l3 vs IL-12p40 (bottom). b Quantification of single- and double-positive cells after co-stimulation for Chi3l3 and IL-12p40 (left) and Chi3l3 and IL-6 (right). c Pairwise odds ratios for all secreted proteins measured in co-stimulated cells. Data are presented as the log2(odds ratio). The color bar indicates the direction and magnitude of the association. Odds ratios with an associated p-value > 0.05 (determined by two-sided Fisher’s exact test) are set to 0. d-e UMAP visualization of single-cell secretion data for 5 proteins (Chi3l3, CCL5, IL-6, IL-12p40, and TNFα), colored by stimulation (d) or consensus cluster (e). f Quantification of the fraction of cells present in each consensus cluster identified by ensemble clustering. g Heatmap of secretion profiles for the five secreted proteins in d grouped by consensus cluster. Inset is a magnified version of the smaller clusters. All single-cell secretion data presented is pooled from two biological replicates. L + I asc. LPS + IFN-γ-associated; IL-4 asc. IL-4-associated. Source data are provided as a Source Data file.

