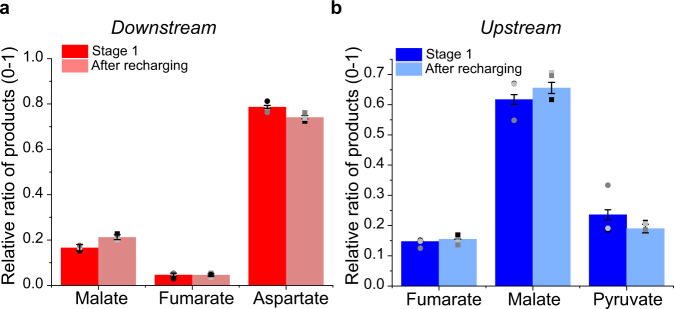
Fig. 4. Analysis of products and intermediates.
Relative percentage of products in the downstream direction (reductive amination/carboxylation) (a), and upstream direction (oxidative deamination/decarboxylation) (b). In both cases, the relative product distribution was maintained after recharging the system with new buffer and substrates. Error bars represent standard errors of the mean taken from three independent repeat experiments (data points plotted as circles for stage 1 and squares after recharging, N = 3).

