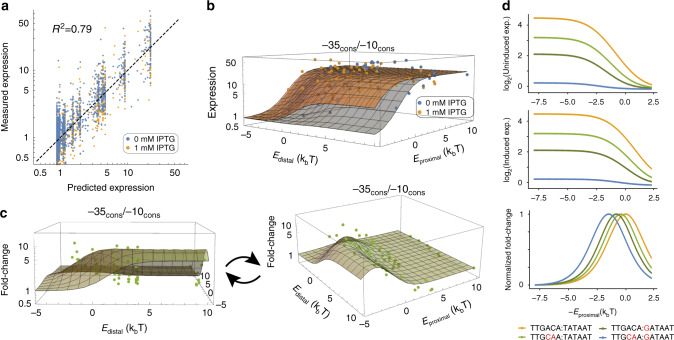
Fig. 3. Thermodynamic modeling of lacUV5 promoter architecture.
a Correlation between actual lacUV5 variant expression and expression fit by our thermodynamic model (r2 = 0.79, P < 2.2 × 10⁻¹⁶, two-sided Student’s t test). b Induced and uninduced gene expression across the distal and proximal site binding energy parameter space. c Fold change (FC) in gene expression as a function of distal and proximal binding site energies. In panels b and c, each dot represents experimental data whereas the grid lines denote the inferred expression of a promoter with the proximal (Eproximal) and distal (Edistal) LacI binding energies shown. d As promoter strength decreases, optimal induction responses are achieved at lower proximal LacI binding site energies. Promoter binding sites are shown as −35 sequence: −10 sequence. These trends are shown in the context of an O1 distal site (Edistal = −0.23). Source data are available in the Source Data file.

