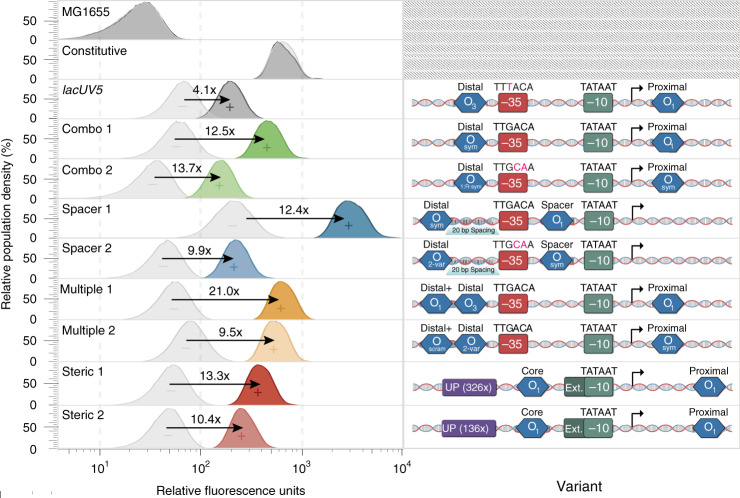
Fig. 5. Characterization of functional inducible variants using a fluorescent reporter.
Fluorescence measurements of selected variants for induced and uninduced states determined using flow cytometry. Fold change of each variant was estimated after background subtracting induced and uninduced expression. “−” represents the promoter in an uninduced state while “+” represents induction after 1 mM IPTG. Source data are available in the Source Data file.

