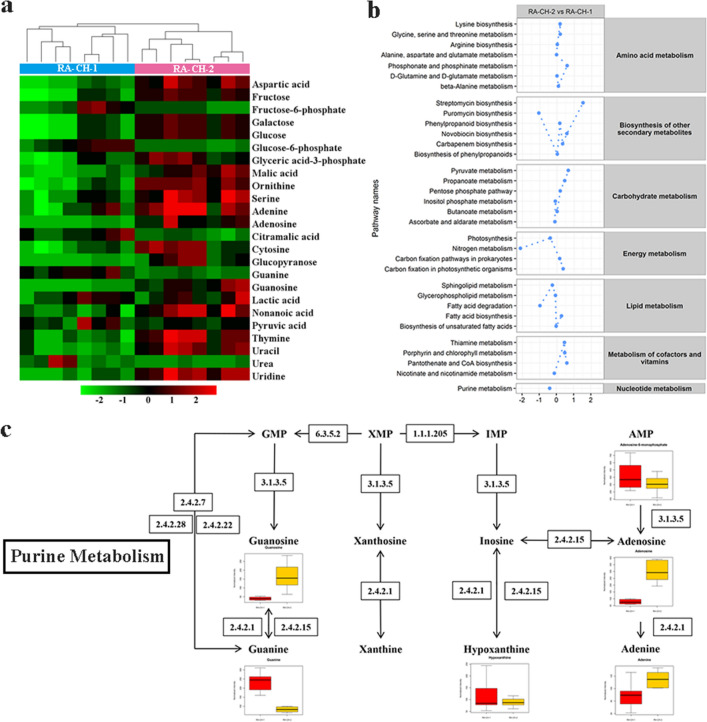
Figure 4.
Comparison of network utilization in RA-CH-1 and RA-CH-2. (a) HAC of 24 biomarkers in two RA strains. RA-CH-1 (8 samples) and RA-CH-2 (8 samples) belonged to two subgroups. (b) Activities of RA metabolic pathways according to comparisons between two RA strains. The activity scores (AS) for each pathway were calculated using the PAPi algorithm. PAPi calculates an AS for each metabolic pathway listed in the KEGG database based on the number of metabolites identified from each pathway and their relative abundances. Related pathways are grouped according to their cellular metabolism and only pathways with statistically significant differences in activity (p < 0.05 by ANOVA) are shown. (c) The pathway of Purine metabolism in RA.

