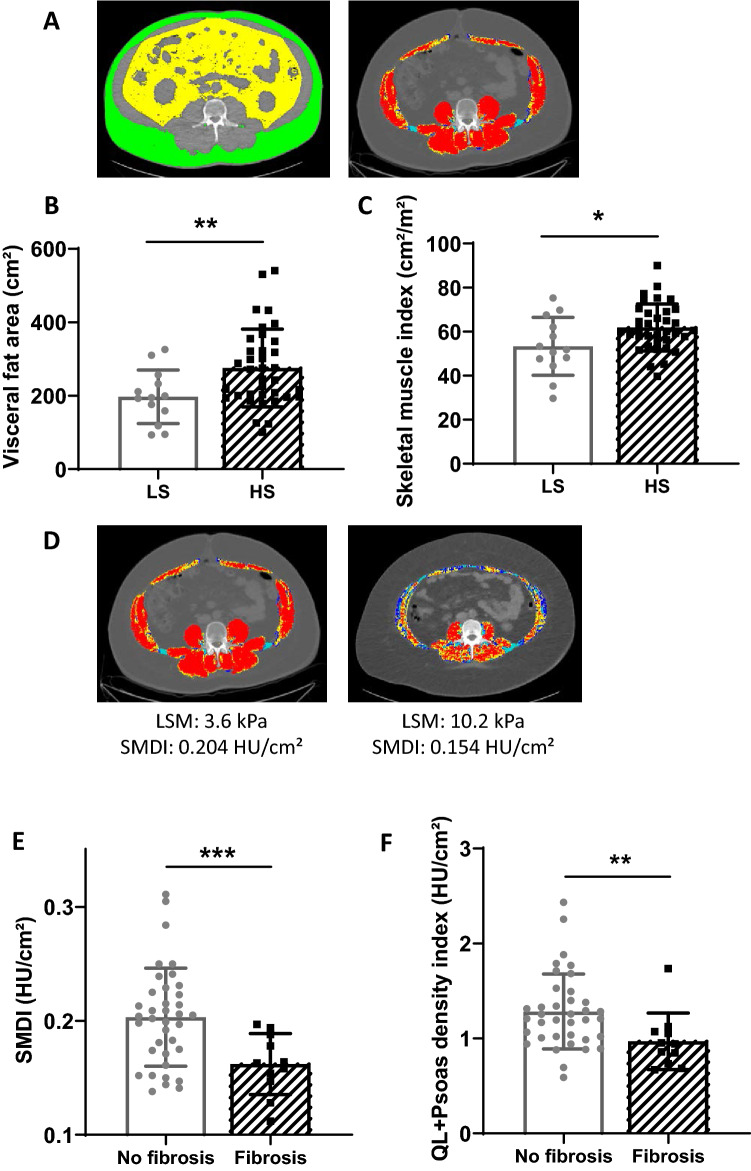
Figure 1.
Body composition evaluation using computed tomography (CT) scan depending on the steatosis and fibrosis grades. Representative picture of the subcutaneous adipose tissue and the visceral fat are evidenced in yellow and green respectively at the third lumbar level, while the muscle area appears in red in patients (A). Mean visceral fat area (B) and skeletal muscle index (C) depending on the steatosis grade. n = 13 for patients with slight/moderate steatosis (LS), n = 36 for patients with severe steatosis (HS). Representative comparison of two MAFLD patients with obesity (D): patient at the left had normal liver stiffness measurement (LSM) with XL probe and normal mean muscle attenuation (skeletal muscles in red) and normal skeletal muscle density index (SMDI), whereas the patient at the right had a high LSM (with the XL probe also compatible with fibrosis), low mean muscle attenuation (skeletal muscles in red, yellow and blue) and low SMDI. Whole muscle density index (E) in the two groups (no fibrosis versus fibrosis) and quadratum lomborum (QL) + psoas density index (F) (n = 36 for patients with no fibrosis, n = 12 for patients with fibrosis. HU: Hounsfield unit. *p < 0.05, **p < 0.01, ***p < 0.001. CT-scan images were processed with the Slice-O-Matic software, version 4.3 (Tomovision, Montreal, Canada). Heatmap representation was performed using Graphpad Prism software version 8 (www.graphpad.com).

