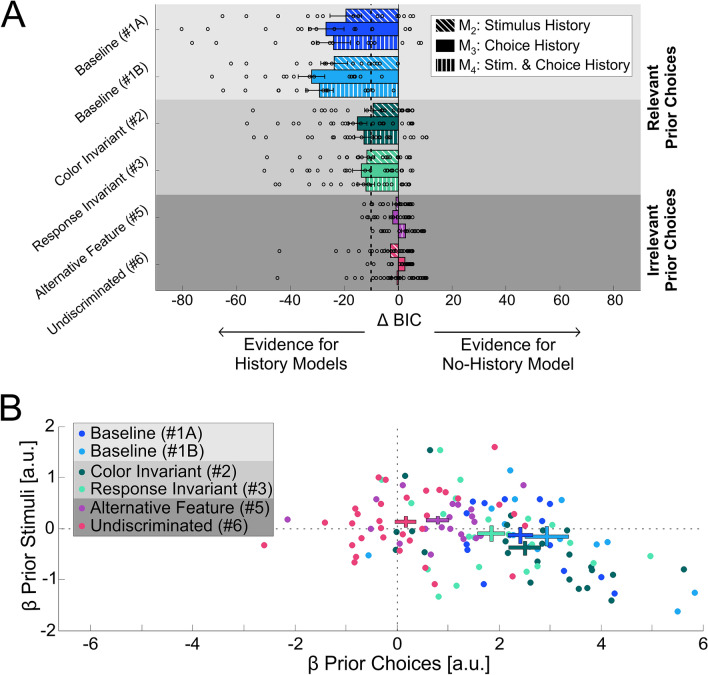
Figure 5.
Model Comparisons. (A) The Bayesian information criterion (BIC) is presented for the three history models in relation to the ‘no history’ model, across experimental conditions. ‘Stimulus history’, ‘choice history’ and ‘stimulus and choice history’ models are represented by the diagonal-stripe, filled and vertical-stripe textured bars (ordered: top, middle and bottom within each condition), respectively. Negative ΔBIC values (ΔBIC = BICMi—BICM1; where M1 represents the ‘no-history’ model and Mi represents one of the ‘history’ models, i = 2, 3 or 4) indicate more evidence for the ‘history’ model. ΔBIC < − 10 is considered very strong evidence for the history model (the vertical dotted line marks ΔBIC = − 10). Circles represent ΔBIC values of individual participants, and bars and error bars mark the mean ± SEM. Choices were better explained by models with history for: the baseline conditions (light gray background) and control conditions (medium gray background) in which the task for the prior stimuli was relevant to the test task, but not for conditions in which the task for the prior stimuli was irrelevant to the test task (dark gray background). (B) Beta coefficients for the prior stimulus vs. prior choice (from the ‘stimulus and choice’ history model M4) are plotted for each participant (data points), per condition (color coded). Crosses represent the mean ± SEM per condition.

