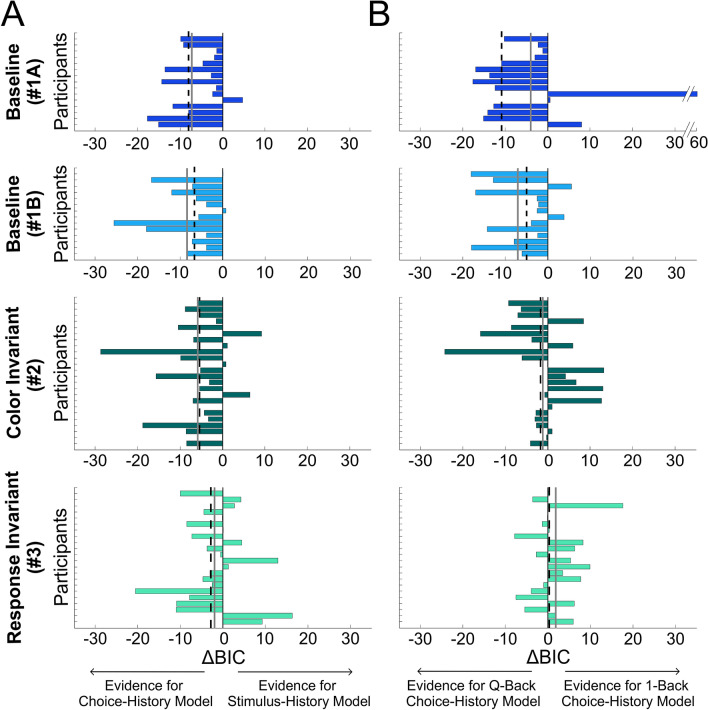
Figure 6.
Choice vs. stimulus history comparison. (A) Comparison between ‘choice-history’ (M3) and ‘stimulus-history’ (M2) models for each participant in the four ‘relevant’ conditions. Negative ΔBIC values mean more evidence for the ‘choice-history’ (vs. ‘stimulus-history’) model. Each bar represents the ΔBIC value for a single participant. The gray solid and black dashed lines represent the mean and median, respectively. (B) Comparison between ‘Q-Back’ and ‘1-Back’ choice-history models for the four ‘relevant’ conditions. Negative ΔBIC values mean more evidence for the ‘Q-Back’ (vs. ‘1-Back’) model.

