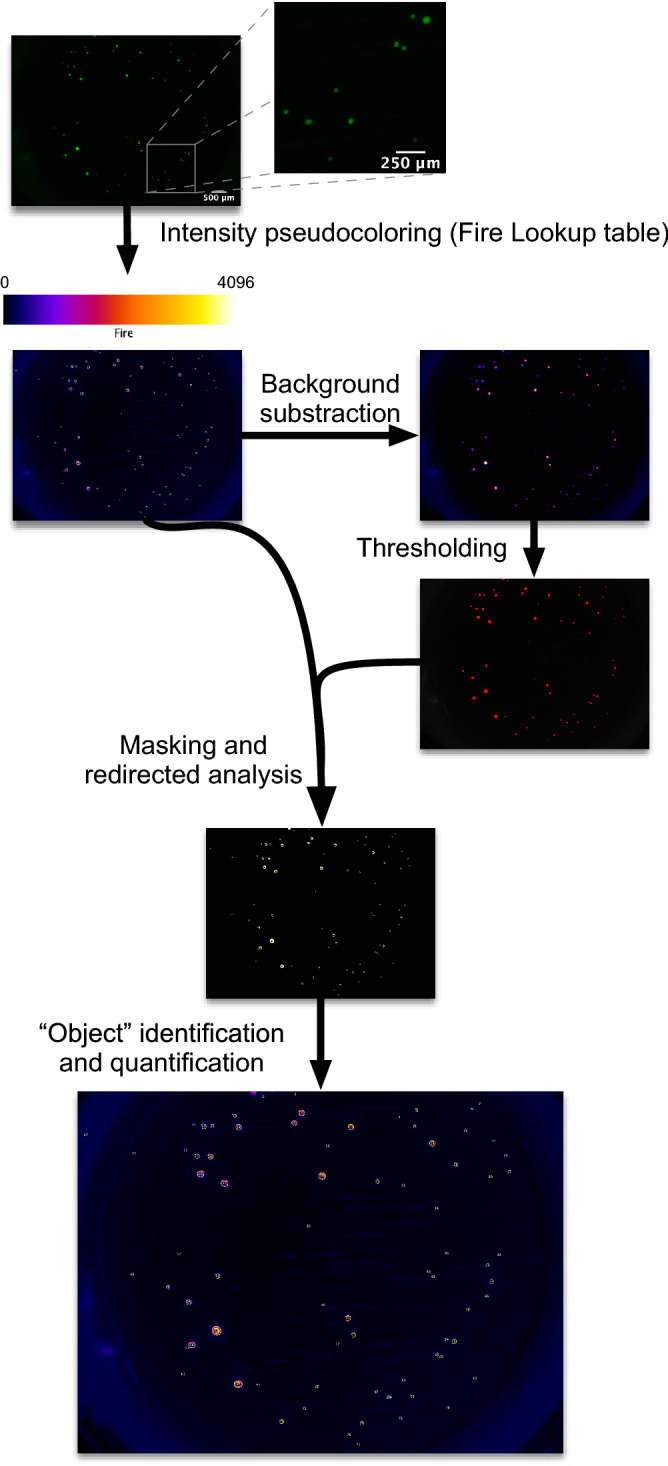
Figure 2.

CpepSfGFP imaging on islets in culture. Flowchart of the imaging and analysis of the CpepSfGFP islets in culture. Captured images (close-up on the right) undergo pseudo-coloring using the “Fire” lookup table (scale on top of the image). Background subtraction and thresholding are used to generate a mask to be used for islet identification on the original image. Each islet or small cluster of islets (defined as “objects”) can be quantified and compared over the different time points. Scale bar on the original image: 500 μm. Scale bar on the close-up: 250 μm.
