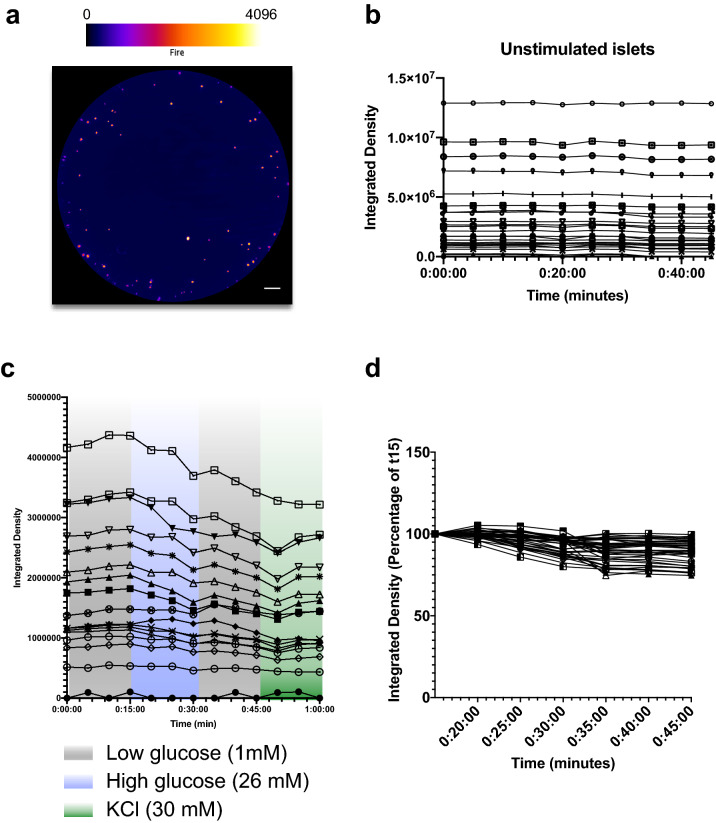
Figure 3.
CpepSfGFP profiles in islets in culture. (a) CpepSfGFP islets in culture in collagen with intensity-based “Fire” pseudocoloring (scale on top). (b) Integrated density of the unstimulated individual CpepSfGFP islets over 45 min of culture. (c) Integrated density of CpepSfGFP individual islets in culture during a GSIS in low (1 mM) glucose, then high (26 mM) glucose, low glucose again and finally KCl (30 mM). (c) Individual islets from figure (c) represented as a percentage change from t15 (time at which the islets are stimulated with glucose). Scale bar 500 μm.

