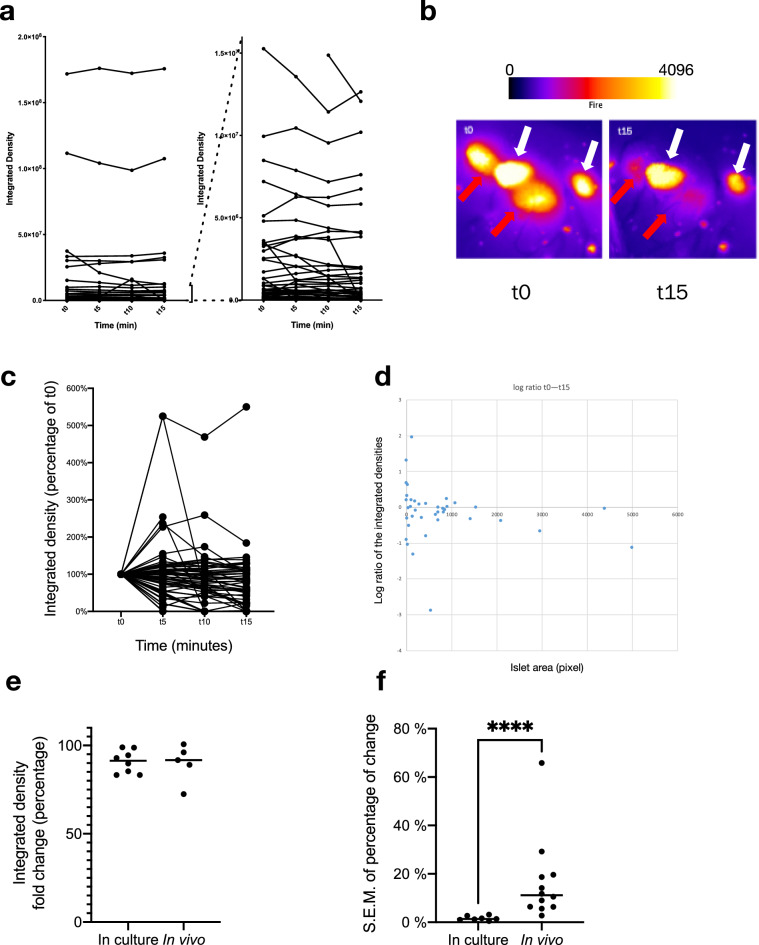
Figure 7.
CpepSfGFP profiles on islets in vivo in anesthetized mice. Expression profiles of the CpepSfGFP islets in vivo in anesthetized mice after a glucose stimulation (gastric infusion) at t0. (a) Expression profile of all individual islets (left) or a subset of smaller islets (different scales on the right) over 15 min. (b) Pseudo-colored islets (fire lookup table, scale above) before stimulation (t0) and after 15 min (t15). The white arrows indicate islets that exhibit only modest changes in 15 min while the red arrows highlight adjacent islets that change dramatically over the same time course. (c) Integrated density of the individual islets expressed as a percentage at t15 relative to their value at t0. (d) Log ratio representation of the islet response based on the integrated density on the vertical axis and their area (expressed in pixels) on the horizontal axis. (e) Comparison of the total islet response to the glucose challenge in culture and in vivo (percentage change of the sum of all integrated densities in a culture well or a pancreas). (f) SEM of the islet response (comparing the distribution of individual islets response expressed as a percentage at t0 compared to t15) of islets in culture compared to islets imaged in vivo. ****p < 0.0001.

