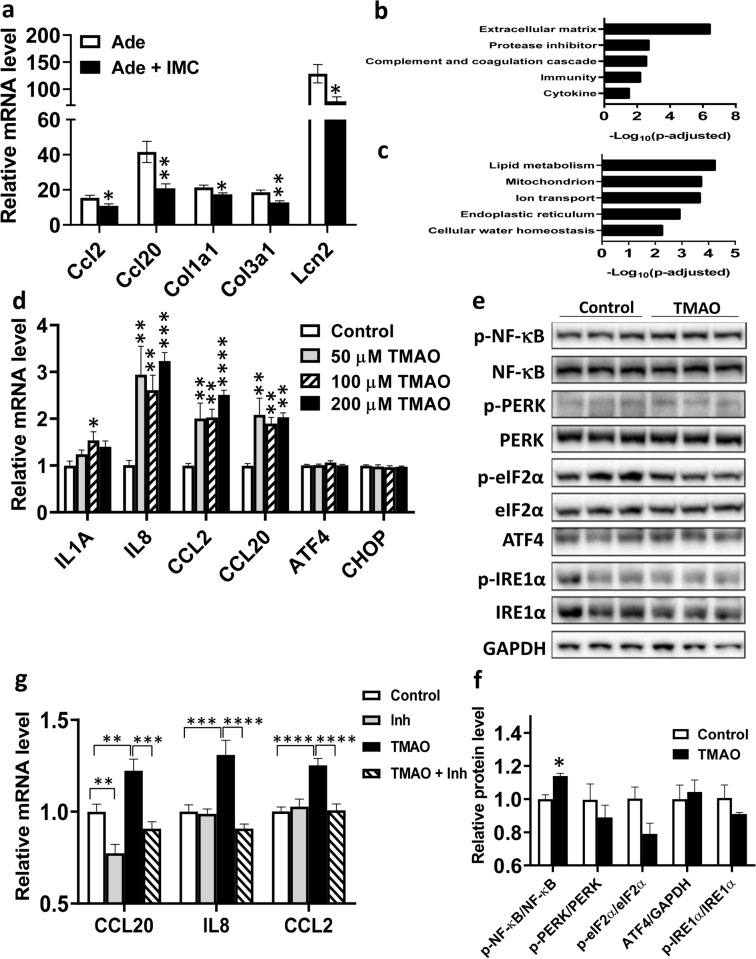
Figure 2.
Inhibition of TMAO generation decreases inflammation and fibrosis in the kidneys of adenine diet-induced CKD. Gene expression analysis of kidney samples from the same mice described in Fig. 1 were performed using qPCR (a), n = 8 to 9 per group, and RNA-seq (b,c). Based on the RNA-seq data, pathway enrichment analysis was performed to identify down-regulated (b), and up-regulated (c) functional clusters in the kidneys of Ade + IMC group compared to the Ade group (n = 6 per group). Gene expression (d, n = 4–5/group) and immunoblotting (e,f, n = 3/group) analysis of MDCK II kidney epithelial cells treated with control, and various doses of TMAO (d) or 200 μM of TMAO (e,f) for 48 h. (g) MDCKII cells were treated with control media, 100 nM NF-κB inhibitor IV (Inh), 200 μM TMAO (TMAO), or 200 μM TMAO + 100 nM NF-κB inhibitor IV (TMAO + Inh) for 48 h before gene expression analysis (n = 9 for each group). For (a,f), two tailed Student’s t-test was performed. Symbols: *p < 0.05, and **p < 0.01. For (d) Post hoc Tukey’s multiple comparisons test was performed after significant one-way ANOVA. Symbols: *p < 0.05, **p < 0.01, ***p < 0.001, and ****p < 0.0001 compared to the control group. For (g) Post hoc analysis was performed after significant two-way ANOVA. Symbols: **p < 0.01, ***p < 0.001, and ****p < 0.0001.

