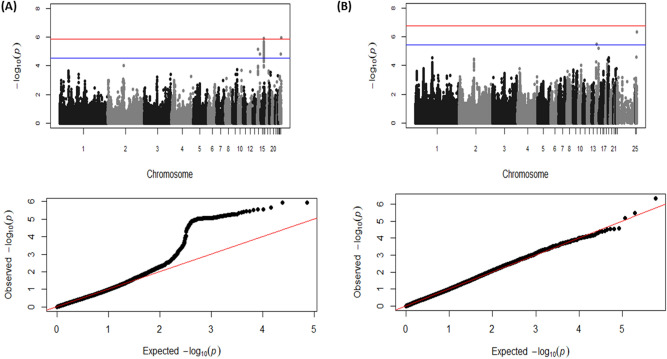
Figure 1.
Manhattan plots and Q–Q plots displaying the GWAS results for chicken Campylobacter colonisation resistance using the 50K (A) and the imputed 600K (B) HD arrays. (i) Genomic location is plotted against – log10(P) in the Manhattan plot. Genome-wide (P < 0.05) and suggestive genome-wide thresholds are shown as red and blue lines, respectively. (ii) Q–Q plot of observed P values against the expected P values for Campylobacter caecal load of (log-transformed CFU of Campylobacter per gram of caeca content).

