
Figure 2.
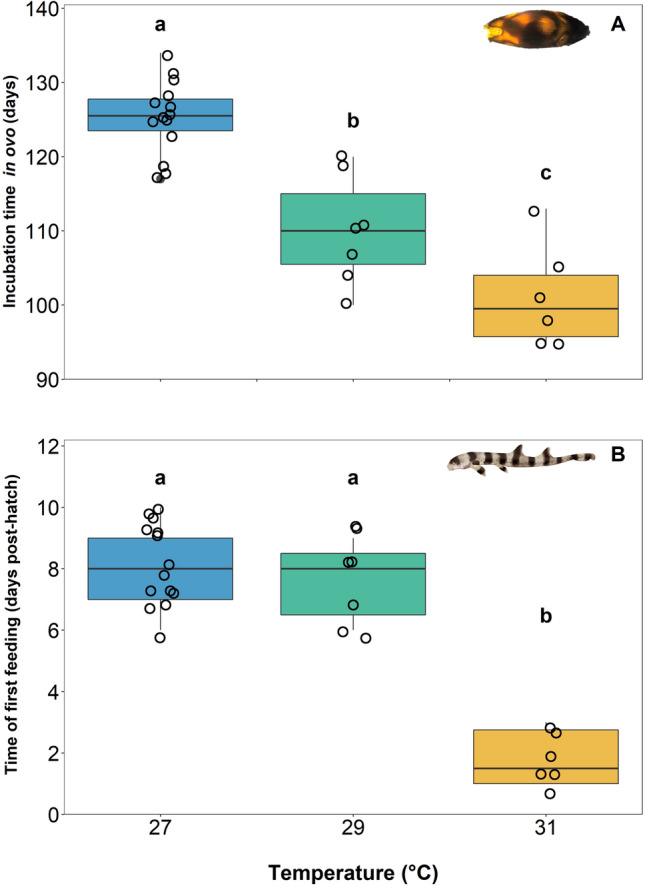
Mean incubation time to hatching (days) (A) and time of first exogenous feeding (post-hatch days) (B) across three treatment temperatures of 27, 29, and 31 °C. Boxes and whiskers represent the median, 25th, and 75th quartiles and 10 and 90th percentiles, respectively. The filled circles represent outliers, and open circles represent observations. Differing lowercase letters denote statistically significant differences at α = 0.05 (see S2).