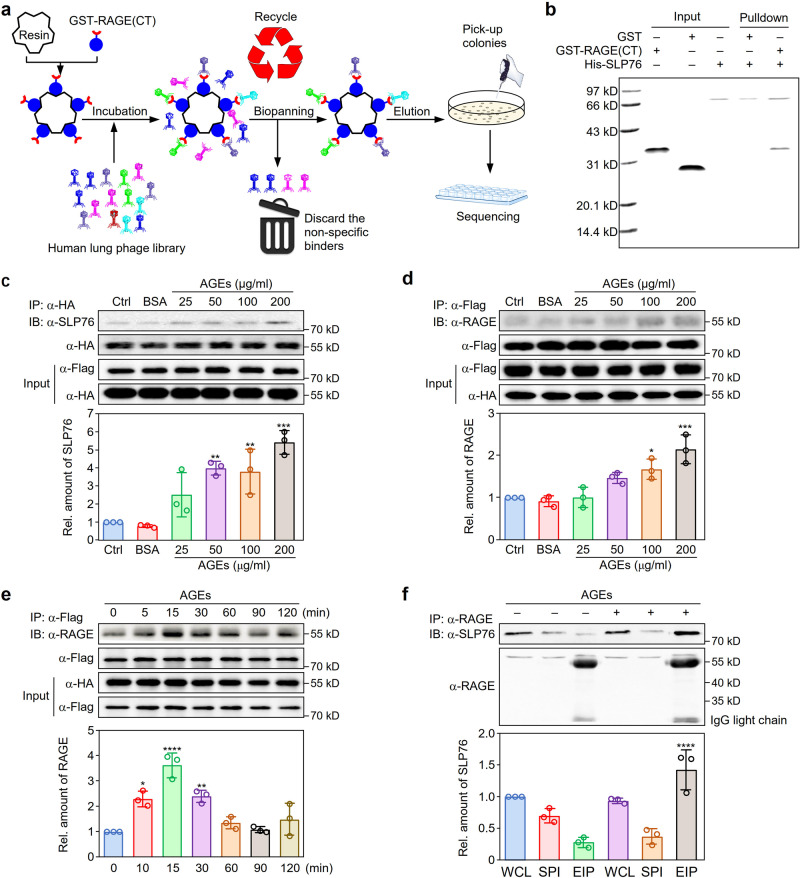
Fig. 1. Identification of SLP76 as a binding protein of the RAGE intracellular domain.
a Schematic diagram showing the T7 phage display system strategy used to screen for the potential proteins binding with the cytosolic tail of RAGE. b In vitro binding of the cytoplasmic domain of RAGE with SLP76. In vitro binding was assessed with recombinant GST-RAGE(CT) and His-SLP76 proteins. GST was used as the control. The experiment was repeated three times with similar results. c Dose-dependent interaction between RAGE and SLP76. Plasmids expressing Flag-tagged SLP76 and HA-tagged RAGE were cotransfected into HEK293 cells. Twenty-four hours after transfection, cells were treated with different doses of AGEs. Co-IP was performed with a specific HA-tag antibody (n = 3). **P < 0.01, ***P < 0.001 versus the control group. d Reverse binding of RAGE to SLP76. The interaction between SLP76 and RAGE was further confirmed by the procedure described in (c) with a specific antibody against the Flag tag for reverse immunoprecipitation (n = 3). *P < 0.05, ***P < 0.001 versus the control group. e Time-dependent interaction between RAGE and SLP76. After cotransfection with plasmids expressing Flag-SLP76 and HA-RAGE, HEK293 cells were treated with AGEs (100 μg/ml) for different times to assess the interaction between SLP76 and RAGE (n = 3). *P < 0.05, **P < 0.01, ****P < 0.0001 versus the control group. f Endogenous interaction between RAGE and SLP76. After stimulation with AGEs (100 μg/ml) for 15 min, RAW264.7 cells were lysed for immunoprecipitation with a specific antibody against RAGE to confirm the endogenous interaction between RAGE and SLP76. The efficiency of Co-IP for RAGE and SLP76 was determined by the intensity ratio of protein bands of SLP76 and RAGE, which was normalized by the corresponding protein bands of input. For SDS-PAGE, the loading volume of the whole-cell lysate (WCL) and supernatant post immunoprecipitation (SPI) was 20 μl (1/20 of input) (n = 3). EIP: eluates from the immunoprecipitated protein G beads. ****P < 0.0001 versus the untreated EIP group. Data are presented as mean ± SD in (c–f). Statistics were performed using one-way ANOVA (c–f) followed by Tukey post hoc. Source data are provided as a Source data file.

