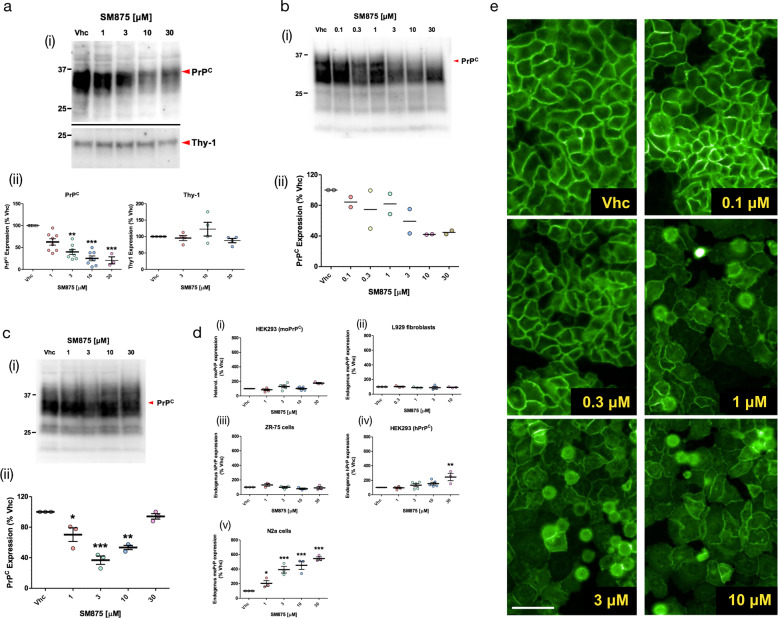
Fig. 3. SM875 lowers the amount of PrP at a post-translational level in different cell lines.
Cells were exposed to different concentrations of SM875 or vehicle (0.1% DMSO) for 48 h, lysed, and analyzed by western blotting. a In ZR-75 cells, SM875 suppresses PrP, but not Thy-1, in a concentration-dependent fashion. b Similar effects were observed in cultured L929 fibroblasts. c In N2a cells, SM875 shows a dose-dependent lowering effect of PrP at 1–10 μM. However, in contrast to the other cell lines, the compound showed no effect at 30 μM. All signals were detected by using a specific anti-PrP (D18) or anti-Thy-1 primary antibodies. Red arrowheads indicate the expected sizes of mature, fully glycosylated forms of PrP or Thy-1. Western blotting analysis (i) and graphs reporting the densitometric quantification of signals (ii) are shown. Each signal was normalized on the corresponding total protein lane (detected by UV of stain-free gels) and expressed as the percentage of vehicle (Vhc)-treated controls (*p < 0.05, **p < 0.01, ***p < 0.005, by one-way ANOVA test). d Graphs show the levels of PrP mRNA upon treatment with SM875, as evaluated by RT-PCR. Specific forward and reverse primers were used to amplify endogenous or exogenous, mouse or human PrP transcripts (see Materials and Methods). Relative quantification was normalized to mouse or human HPRT (hypoxanthine–guanine phosphoribosyltransferase). Statistical analyses refer to the comparison with vehicle controls (**p < 0.01, ***p < 0.005, by one-way ANOVA test). Dots represent biologically independent replicates. e HEK293 stably expressing a PrP form tagged with a monomerized EGFP molecule at its N-terminus (EGFP-PrP) were incubated with vehicle (0.1% DMSO) control (i) or SM875 at different concentrations (ii–vi) for 24 h. Fluorescence of the EGFP protein was then visualized with an Olympus BX51WI microscope equipped with reflected fluorescence. Scale bar 50 μm.

