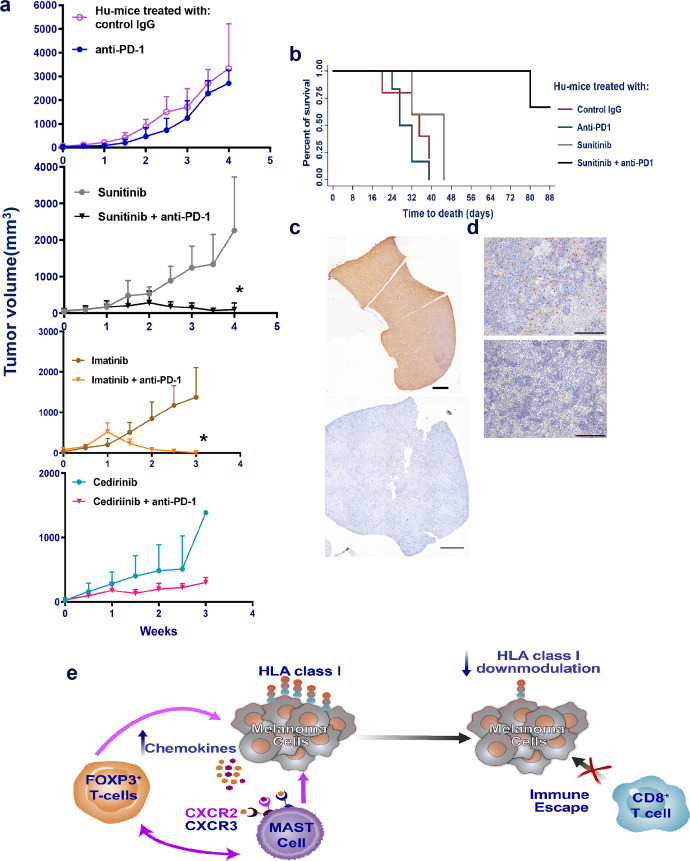
Fig. 6. Complete regression of tumors after a combination of sunitinib and anti-PD therapy.
a Using an independent batch of Hu-mice, established tumors (A375) (details as in Fig. 2g, h; n = 5/group) were treated with sunitinib (20 mg/kg) daily by oral gavage and after 72 h, anti-PD-1 therapy (10 mg/kg) was given weekly for a total of 6 injections. Complete tumor regression was observed in presence of combination therapy (black inverted triangle; p = 0.0001; 2nd panel), while sunitinib alone (gray circles), anti-PD-1 alone (blue line, closed circles) or control IgG (magenta; open circles) did not have any effect of tumor growth. We observed similar results when drug imatinib (50 mg/kg; daily by oral gavage) was used in combination with anti-PD-1 (brown line, closed circles; p = 0.0282; n = 7; 3rd panel from the bottom). Imatinib alone had no effect on tumor growth. Cediranib (6 mg/kg; daily by oral gavage) either alone or in combination with anti-PD-1 antibody was unable to shrink the tumors (n = 3 per group; bottom panel). Data are presented as mean values ± SD. A one-sided paired t-test was used for analysis when p-values are provided. b Survival curve from the above-treated mice indicates significant (p = 0.0013 as determined by the log-ranked test) survival advantage of tumor-bearing Hu-mice that received combination therapy of sunitinib and anti-PD-1 group when compared to sunitinib alone (gray), or anti-PD-1 alone (dark blue) or control IgG (magenta) groups. c, d Depletion of mast cells in spleen in sunitinib treated mice (bottom [1000] μm left and right panels [100] μm) when compared to control mice (top left [1000] μm and right panels [100] μm panel). Histology staining (c, d) was confirmed in repeat experiments (2×). e Schema of mast cell-induced resistance mechanism to anti-PD-1. Source data are provided as a Source Data file.

