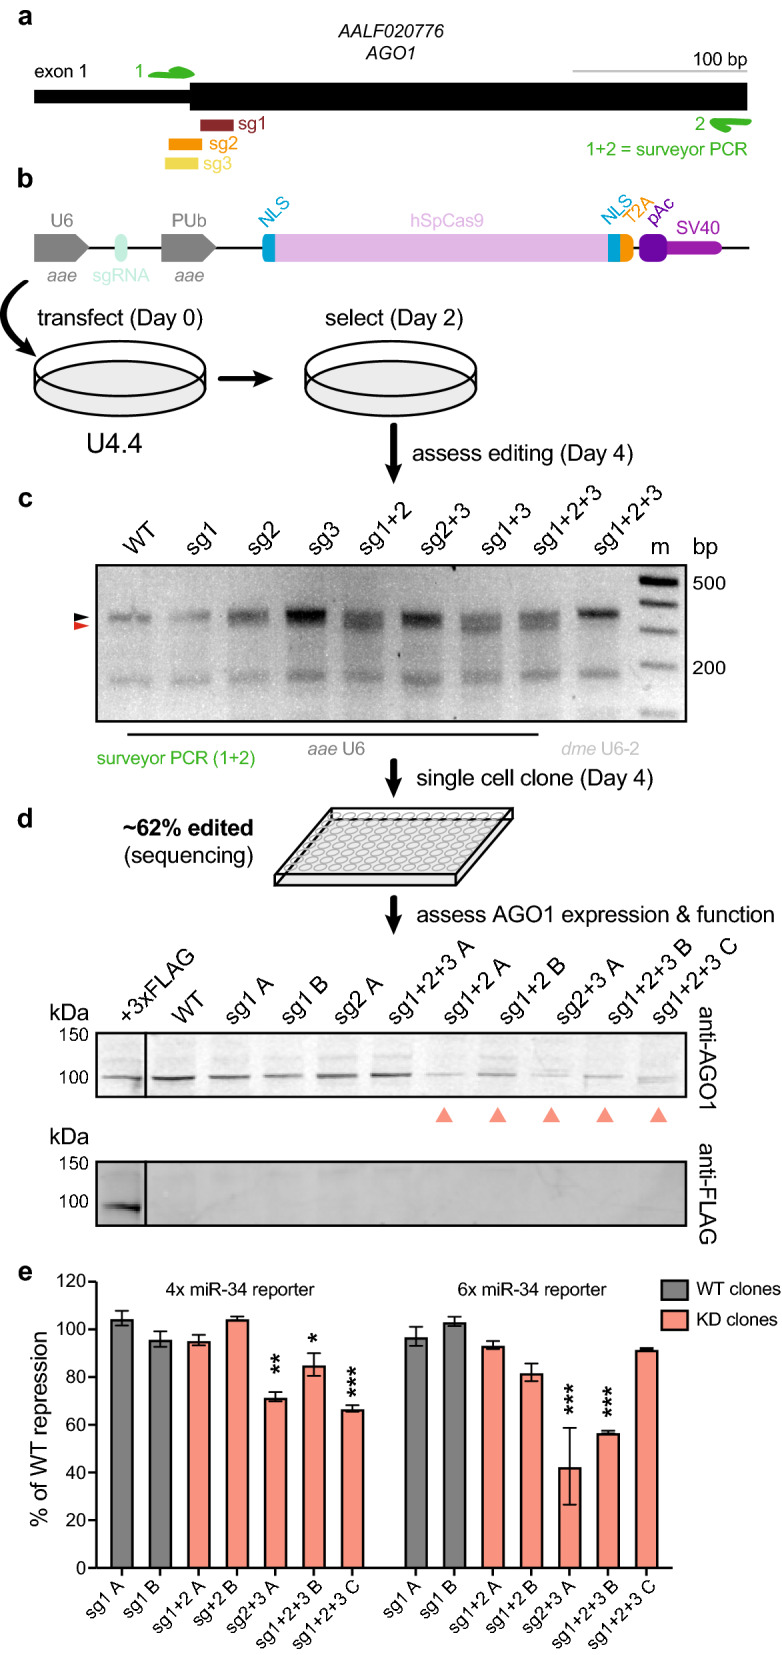
Figure 3.

Isolation of AGO1-deficient U4.4 clonal cell lines. (a) Three sgRNAs were designed near the translation start site for the AGO1 locus in U4.4 cells. Note the diagram shown differs from the Ae. albopictus annotation (AaloF1.2) and is based on sequencing of U4.4 cells. A PCR was designed for surveyor assay (primers = green arrows). (b) U4.4 AGO1 sgRNAs were cloned into pKRG3, and U4.4 cells were transfected with these plasmids singly or in combination. Workflow to obtain edited cells is shown. (c) Editing efficiency was assessed by surveyor assay. Expected size of wild-type (WT) amplicon = ~ 350 base pairs (bp; black arrow); expected size of digested fragments based on sgRNA cleavage sites = ~ 330 bp (red arrow) + ~ 23 bp (not visible), In comparison to the aae U6 promoter, no editing is observed with the same guides using the dme U6-2 promoter (both plasmids express hSpCas9 using PUb promoter). m = marker. (d) Single cells clones were sequenced to assess the percentage of edited clones. Immunoblot of AGO1 (top) showed clones with WT and reduced (salmon arrows) AGO1 protein levels; A, B, C denote clones. The ectopically expressed, 3xFLAG-tagged U4.4 AGO1 was detected by both the anti-AGO1 antibody and the anti-FLAG antibody (bottom). (e) Luciferase reporter assay measuring repression of 4 or 6 repeated miR-34 sites (4 ×, 6 × miR-34 reporter). Repression for each clone was measured by normalizing to internal transfection controls (reporter luciferase/control luciferase), then to unrepressed reporters in the same clone. The percent (%) of repression compared to WT clones sg1 A and sg1 B is shown. p < 0.0001 (overall ANOVA comparing different clones); individual groups were compared using the Dunnett's post hoc test compared to the WT clone sg1 A; *p < 0.05, **p < 0.001, ***p ≤ 0.0001. All full-length immunoblots in Supplementary Fig. 4; all full-length DNA gels in Supplementary Fig. 5.
