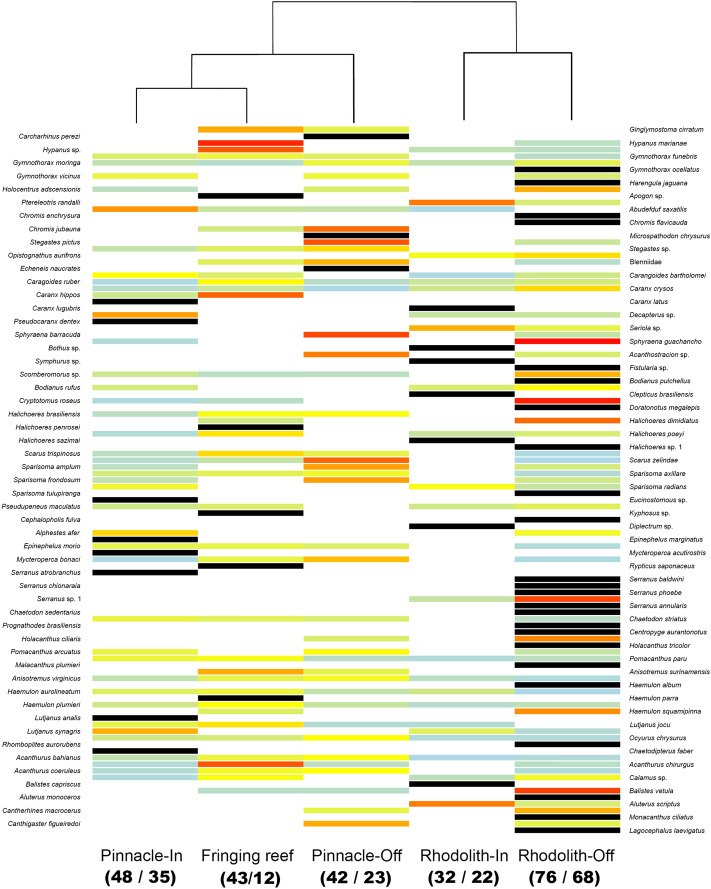
Figure 2.
Reef fish abundance in the Abrolhos Shelf. The heatmap was built using relative abundances (rows) weighted by the sampling effort at each sampled strata (columns). Absences are assigned to white, whereas increasing relative abundances are colored from light blue (0.002) to red (0.96). Unique occurrences are shown in black. Column orders were arranged by transforming a matrix of Bray–Curtis dissimilarities among strata into distances (UPGMA). Numbers in parenthesis bellow each habitat column indicate total species richness / number of BRUV deployments. Generated with Freeware R (www.r-project.org), using package gplots.

