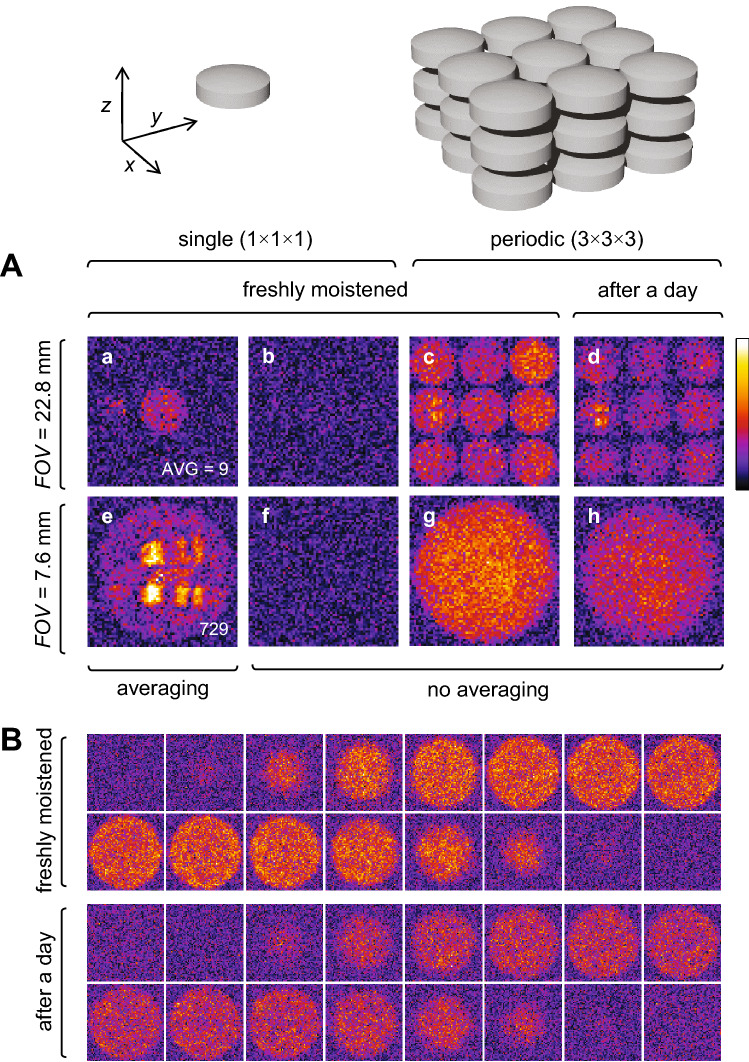
Figure 4.
SPI images of tablets. (A) 2D SPI images of (a,b,e,f) a single tablet and of (c,d,g,h) a periodic sample of tablets at the FOV equal to: (c–d) triple and (e–h) single unit cell size. (b,f) The single tablet sample does not produce a detectable signal. (a,e) With sufficient averaging the signal becomes comparable to that of (c,g) the periodic sample without averaging. (d,h) After a day, this signal is lower due to moisture loss. (B) 3D SPI images of the periodic tablet sample freshly moistened and after a day.

