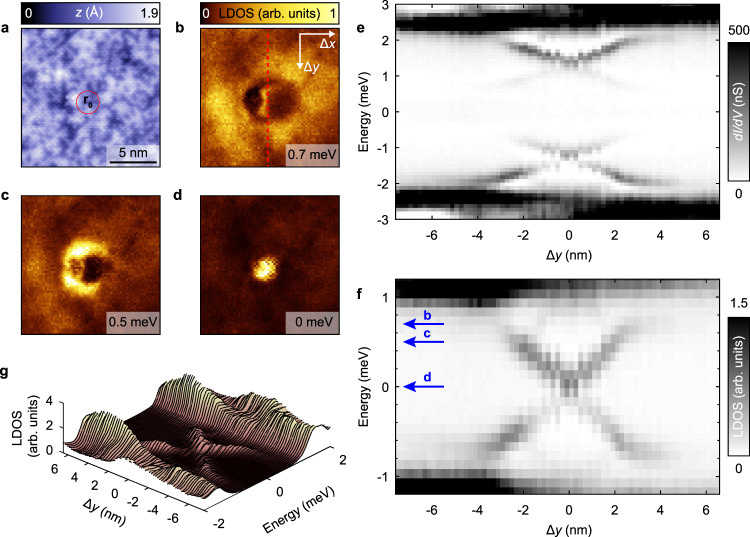
Fig. 2. X-shaped spatial dispersion of impurity resonances in FeTe0.55Se0.45.
a Topographic image at the impurity location (r0 indicates the impurity center). No clear signature of the impurity is observed. Setup conditions: Vset = −8 mV, Iset = −100 pA. b–d Spatially resolved LDOS maps at different energies obtained by deconvolution of a dI/dV (r, V) map in the same field-of-view as in a. The energy of each LDOS map is indicated at the bottom right corner. e Measured differential conductance intensity plot of a vertical linecut passing through the impurity center r0 (Δy = 0 nm). The linecut was taken along the red dashed line in b. A crossing of the in-gap resonances at the impurity center is observed. Setup conditions: Vset = −8 mV, Iset = −1.6 nA. Lock-in modulation is μV peak-to-peak, f Deconvolution of the measured spectra in e shows an X-shaped dispersion of the sub-gap states crossing the Fermi level at the impurity center. The blue arrows indicate the energy of the maps in b–d. g Series of LDOS spectra depicting the X-shaped spatial dispersion shown in f.

