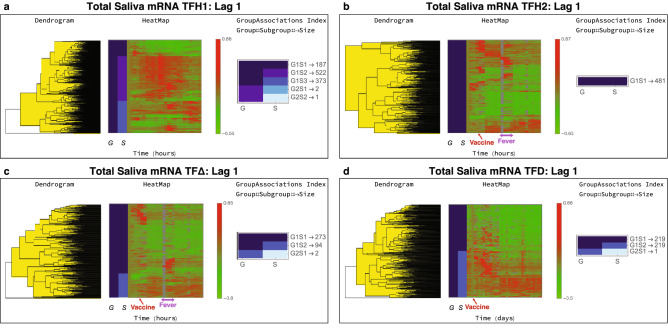
Figure 5.
Total saliva mRNA time series trends. The Lag 1 classification results from MathIOmica are shown for the different time frames. (a) During TFH1 the subject followed their normal routine. (b) During TFH2, the subject was vaccinated with PPSV23. For both TFH1 and TFH2 the first timepoint corresponds to 7 am. Vaccination took place at 10.30 am. The subject reported fever from 5.30 to 10 pm. (c) The results correspond to paired differences between TFH2 and TF1 hourly points, to remove intra-day variation so as to focus on the perturbation vaccination responses. The plot is indicative of a response to the vaccine and a response that coincides with the reported fever. (d) For the daily data, TFD, the corresponding vaccine timepoint is Day 3. There is a direct response the days following the vaccination, and a different response in a subset of genes approximately a week following the vaccination, corresponding to immune system activation.

