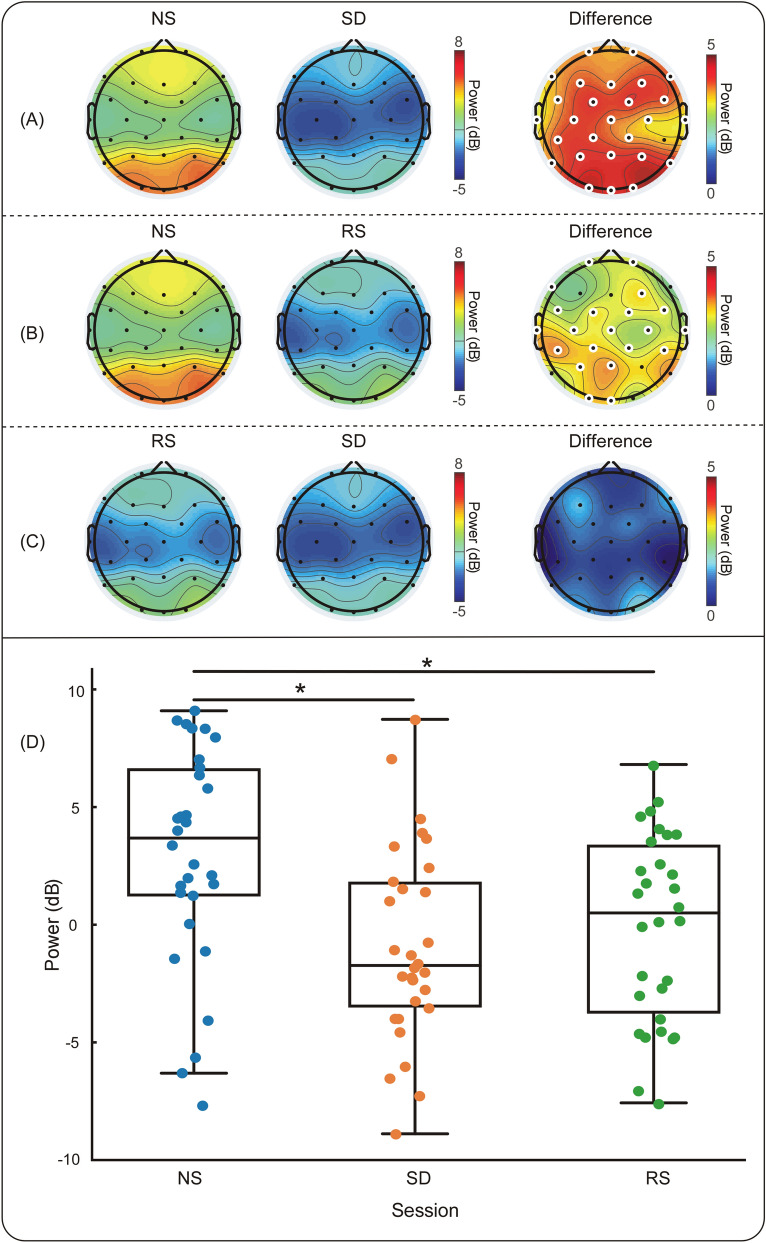
Figure 1.
Alpha power differences. (A) Topographical distribution of NS and SD sessions. (B) Topographical distribution of NS and RS sessions. (C) Topographical distribution of RS and SD sessions. (D) Variability of the average power spectrum of the whole brain across subjects in the three sessions (NS vs. SD vs. RS, mean ± standard deviation: 3.133 ± 4.718 dB vs. − 0.771 ± 4.223 dB vs. 0.068 ± 4.061 dB). * p < 0.05. Enlarged white circles represent electrodes with significant differences. Abbreviations: NS, normal sleep; SD, sleep deprivation; RS, recovery sleep.

