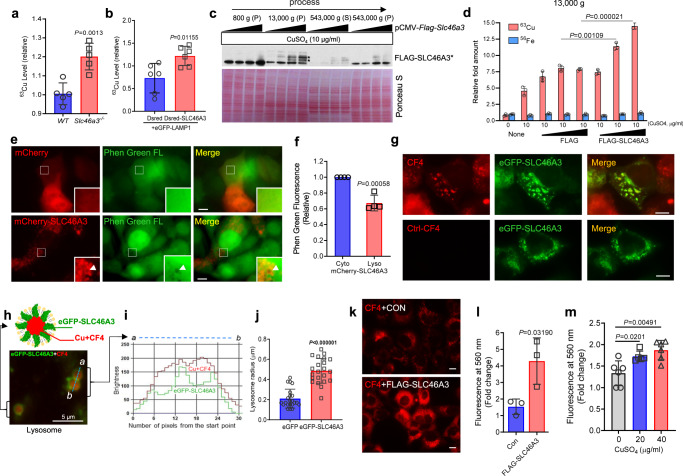
Fig. 3. Copper is a possible substrate of SLC46A3 in lysosome.
a Hepatic Copper 63 (63Cu) level analysis using inductively coupled plasma mass spectrometry (ICP-MS) in WT (n = 5 per group) and Slc46a3−/− (n = 5 per group) mice. b Relative 63Cu level in the lysosomal fraction from eGFP-Lamp/DsRed or eGFP-Lamp/DsRed-SLC46A3-expressing mouse liver (n = 3 per group). c FLAG-SLC46A3 fractions in different centrifugal forces using Hepa1c1c7 cells. P pellet, S supernatant. d Copper transporter assay using FLAG-SLC46A3-expressing Hepa1c1c7 cells in the presence of copper sulfate (n = 3 biologically independent samples). e Measurement of the relative quenching effect by heavy metals using Phen Green FL dye in mcherry-SLC46A3-expressing Hepa1c1c7 cells. The representative images were obtained from three independent experiments. Arrows indicate lysosomes. Scale bar, 10 μm. f Relative green fluorescence was measured relative to cytoplasmic and lysosomal locations. Cyto cytoplasm, Lyso lysosome. g Fluorescence images show labile copper-sensing probe CF4 localized in the eGFP-SLC46A3 embedding lysosomes in Hepa1c1c7 cells. Ctrl-CF4 probe was used as a control. All images were pictured under the same conditions. The representative images were obtained from three independent experiments. Scale bar, 10 µm. h A model of copper-encapsulated lysosome with eGFP-SLC46A3 was depicted. The representative images were obtained from three independent experiments. i Locations of eGFP-SLC46A3 and Cu-CF4 were presented with the brightness of each color from the section (a to b) of two neighboring lysosomes. j Lysosomal sizes were measured in the presence of eGFP or eGFP-SLC46A3 in Hepa1c1c7 cells. k Hepa1c1c7 cells were transfected with FLAG-SLC46A and incubated with CF4 (1 µM) for 10 m. Red fluorescence color indicates Cu-CF4 complex. The representative images were obtained from three independent experiments. Scale bar, 10 μm. l The Red-light intensity was measured using a fluorescence plate reader (Ex. 540/Em 560). m To control the CF4-Cu sensing experiment, Hepa1c1c7 cells were treated with different doses of CuSO4 for 10 m and incubated with CF4 (1 µM) for 10 m. The CF4 emission light was read using a fluorescence plate reader (Ex. 540/Em 560). Each data point represents the mean ± SD and adjusted p value, presented in the panels, was determined by unpaired two-tailed Student’s t test using indicated sample sizes and groups.

