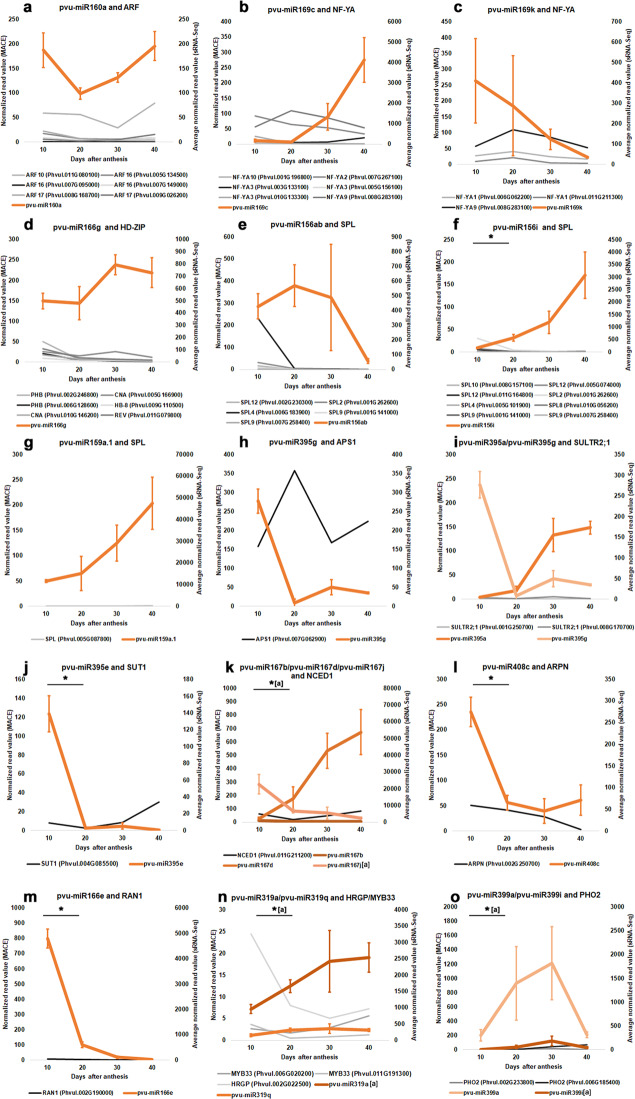
Fig. 3. Expression profiles of selected miRNAs and targets during seed development in Phaseolus vulgaris.
The expression profiles of the miRNAs were obtained using the average normalized read values from sRNA-Seq analysis at 10, 20, 30, and 40 days after anthesis (DAA). a pvu-miR160a and ARF members. b pvu-miR169c and NF-YA members. c pvu-miR169k and NF-YA members. d pvu-miR166g and HD-ZIP members. e pvu-miR156ab and SPL members. f pvu-miR156i and SPL members. g pvu-miR159a.1 and SPL. h pvu-mir385g and APS1. i pvu-miR395a/pvu-miR295g and SULTR2;1. j pvu-miR395e and SUT1. k pvu-miR167b/pvu-miR167d/pvu-miR167j and NCED1. l pvu-miR408c and ARPN. m pvu-miR166e and RAN1. n pvu-miR319a/pvu-miR319q and HRGP/MYB33. o pvu-miR399a/pvu-miR399i and PHO2. Error bars show the standard deviation from three sequenced biological replicates and the asterisk indicates a statistically significant difference (adj P-value ≤ 0.05) between consecutive timepoints. When more than one miRNA is depicted, the asterisk is followed by letters inside square brackets indicating the DE miRNA. The target expression profiles were produced using the normalized read value for target genes at the same timepoints retrieved from MACE datasets available in Parreira et al.5

