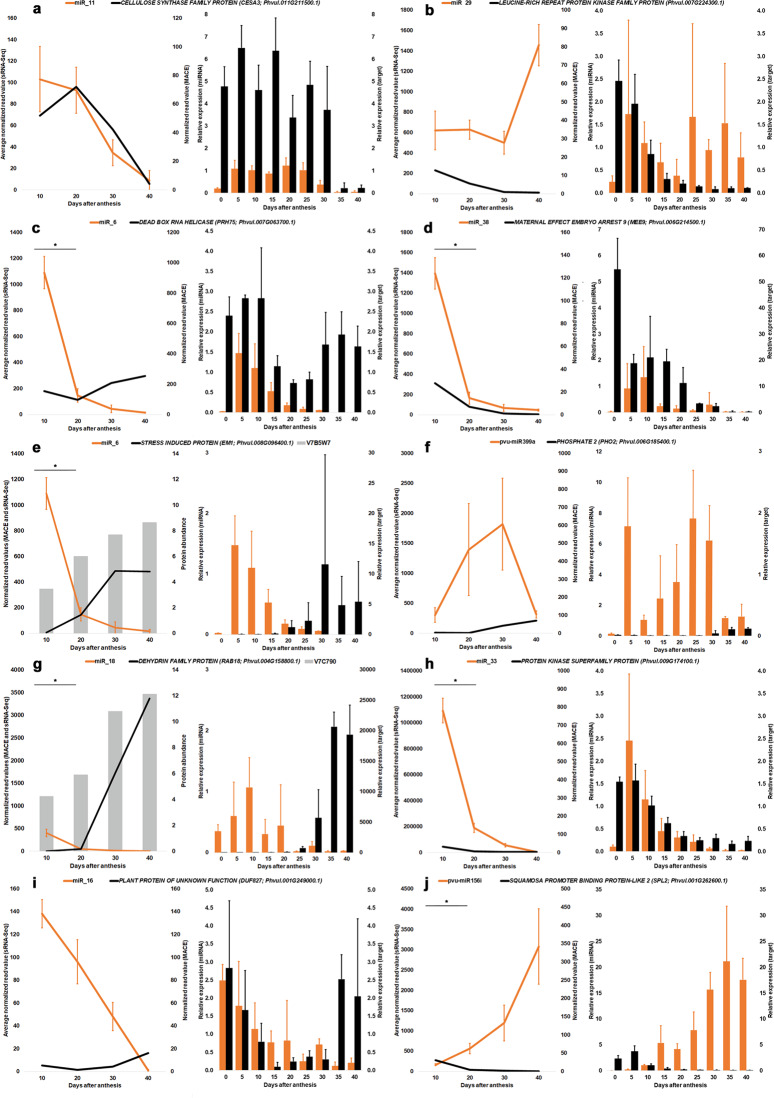
Fig. 4. Expression profiles of selected miRNAs and targets differentially expressed during seed development in Phaseolus vulgaris.
(Left panel) Expression profiles of the miRNAs were obtained using the average normalized read values from sRNA-Seq analysis at 10, 20, 30, and 40 days after anthesis (DAA). a miR_11 and CESA3. b miR_29 and LEUCINE-RICH PROTEIN KINASE FAMILY PROTEIN. c miR_6 and PRH75. d miR_38 and MEE9. e miR_6 and EM1. f pvu-miR399a and PHO2. g miR_18 and RAB18. h miR_33 and PROTEIN KINASE SUPERFAMILY PROTEIN. i miR_16 and DUF827. j pvu-miR156i and SPL2. Error bars show the standard deviation from three sequenced biological replicates, the asterisk indicates a statistically significant difference (adj P-value ≤ 0.05) between consecutive timepoints. The target expression profiles were produced using the normalized read value for target genes at the same timepoints retrieved from MACE datasets available in Parreira et al.5. For e and g, the protein average normalized intensity values at the same timepoints retrieved from the datasets available in Parreira et al.4. (Right panel) Relative expression (RT-qPCR) profiles were obtained for miRNA:target pairs in the ovary (herein defined as 0 DAA) and at subsequent eight seed development timepoints

