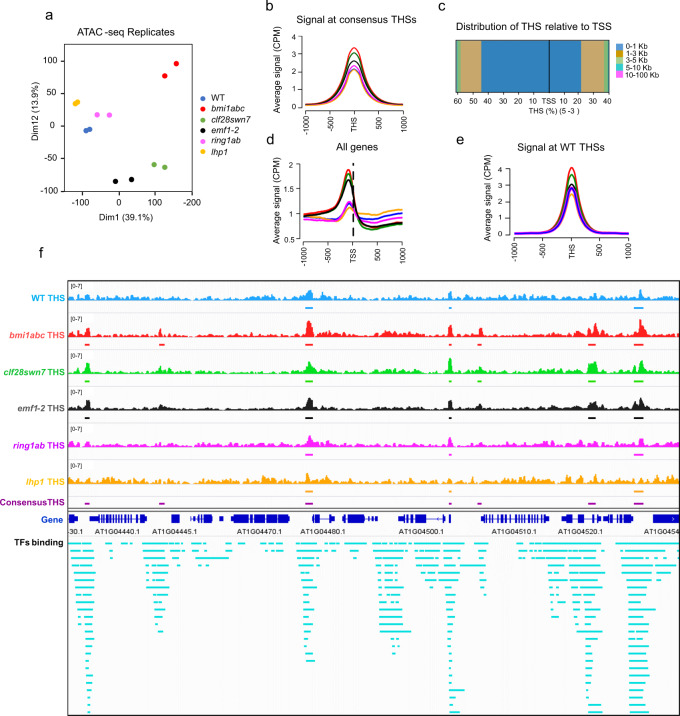
Fig. 1. Consensus THSs co-localize with transcriptional regulation hotspots.
a PCA analysis of WT, bmi1abc, clf28swn7, emf1-2, lhp1, and ring1ab ATAC-seq replicates at 10 DAG. b Average signal levels at the center of consensus THSs in WT, bmi1abc, clf28swn7, emf1-2, lhp1, and ring1ab mutants. c Distribution of consensus THSs relative to TSS. The percentage of THSs found in different intervals is indicated in different colors. d Average accessibility profile of coding genes at the region surrounding the TSS in WT and mutants. e Average signal levels at the center of WT THSs in WT, bmi1abc, clf28swn7, emf1-2, lhp1, and ring1ab mutants. f Screenshot showing distribution of genotype-specific THSs, consensus THSs, and TFs binding sites (see also Supplementary Data 2). Each genotype is indicated in different color (WT in blue, bmi1abc in red, clf28swn7 in green, emf1-2 in black, ring1ab in pink, and lhp1 in orange). Consensus THSs are indicated in magenta. Gene regions are indicated in dark blue and the binding sites of TFs in greenish blue.

