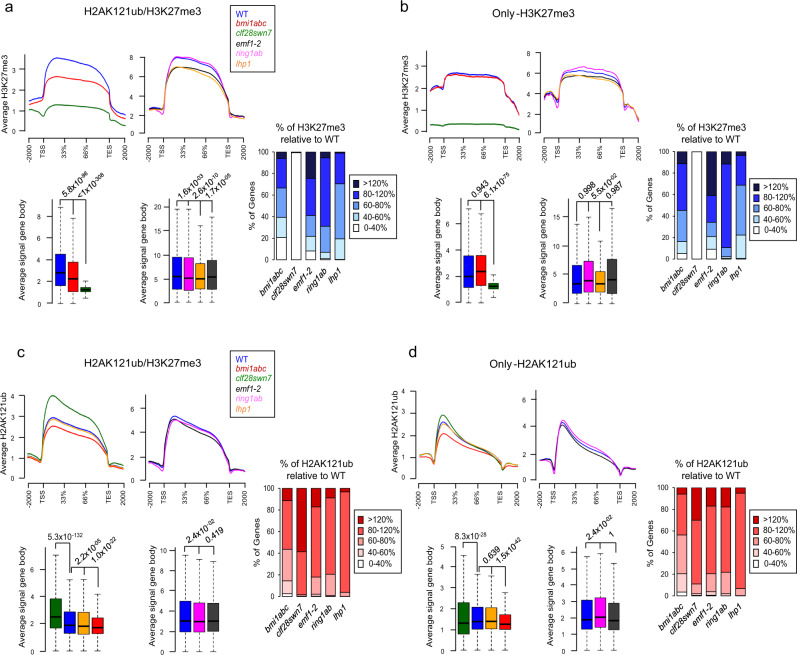
Fig. 3. H2AK121ub and H3K27me3 levels in mutant and WT seedlings.
a Metagene plots of H3K27me3 coverage at H2AK121ub/H3K27me3-marked genes in the different mutants. Left panel shows results using previously published data28 and right panel using data generated in this work (see “Methods”). Bar plots indicate the percentage of genes displaying different levels of H3K27me3 marks relative to WT in each mutant. Box plots below metagene plots show average signal at gene body in the different genotypes. The median (middle line), upper and lower quartiles (boxes), and minimum and maximum values (whiskers) are indicated. P values of differences between WT and mutants according to one-sided Mann–Whitney–Wilcoxon test are also indicated. b Same as in a but for only-H3K27me3-marked genes. Box plots below metagene plots show average signal at gene body in the different genotypes. The median (middle line), upper and lower quartiles (boxes), and minimum and maximum values (whiskers) are indicated. P values of differences between WT and mutants according to one-sided Mann–Whitney–Wilcoxon test are indicated. c Metagene plots of H2AK121ub coverage at H2AK121ub/H3K27me3-marked genes in the different mutants. Left panel results using previously published data28 and right panel using data generated in this work (see “Methods”). Bar plots indicate the percentage of genes displaying different levels of H2AK121ub marks relative to WT in each mutant. Box plots below metagene plots show average signal at gene body in the different genotypes. The median (middle line), upper and lower quartiles (boxes), and minimum and maximum values (whiskers) are indicated. P values of differences between WT and mutants according to one-sided Mann–Whitney–Wilcoxon test are indicated. d Same as in c but for only-H2AK121ub-marked genes. Box plots below metagene plots show average signal at gene body in the different genotypes. The median (middle line), upper and lower quartiles (boxes), and minimum and maximum values (whiskers) are indicated. P values of differences between WT and mutants according to one-sided Mann–Whitney–Wilcoxon test are indicated. In all cases (a–d), data were generated from n = 2 biological independent ChIP-seq samples. The list of only-H2AK121ub, H2AK121ub/H3K27me3, and only-H3K27me3 marked genes are provided as a Source Data file.

