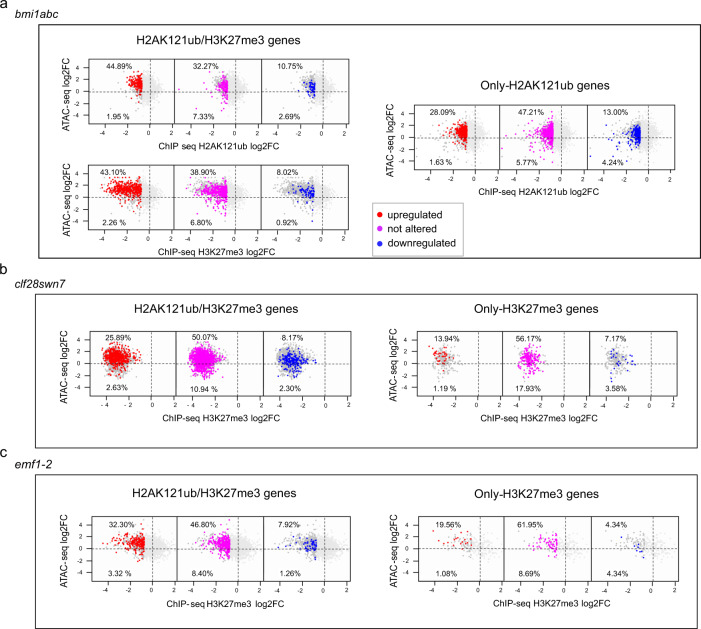
Fig. 5. Increased chromatin accessibility in PcG mutants is not necessarily accompanied by gene expression.
a Scatter plots showing the relationship between THS accessibility and marks levels (H2K121ub or H3K27me3) at H2AK121ub/H3K27me3 (left) and only-H2K121ub marked genes (right) in bmi1abc mutant. b Scatter plots showing the relationship between THS accessibility and H3K27me3 levels at H2AK121ub/H3K27me3 (left) and only-H3K27me3 marked genes (right) in clf28swn7 mutant. c Scatter plots showing the relationship between THS accessibility and H3K27me3 levels at H2AK121ub/H3K27me3 (left) and only-H3K27me3 marked genes (right) in emf1-2 mutant. In each panel, top numbers indicate the percentage of genes displaying altered or unaltered expression levels within the subset of genes showing less than 60% of WT H2K121ub or H3K27me3 (cutoff log2FC ≤ −0.74) and increased accessibility compared to WT. While bottom numbers indicate the same for the genes with less than 60% of WT H2K121ub or H3K27me3 and decreased accessibility compared to WT. The sum of top and bottom numbers from each panel represent 100% of the genes with less than 60% of WT H2K121ub or H3K27me3 and altered accessibility compared to WT. Upregulated expression is indicated in red, not altered expression in pink, and downregulated expression in blue. Source data are provided as a Source Data file.

