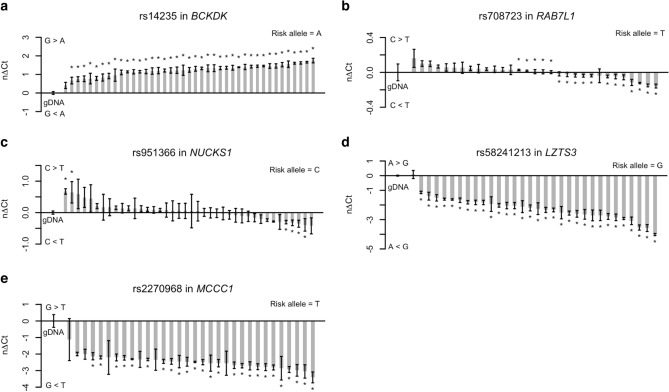
Figure 4.
Tissue-specific allelic expression is observed in selected PD-associated risk loci. Allelic expression analysis of (a) rs14235 in BCKDK, (b) rs708723 in RAB7L1, (c) rs951366 in NUCKS1, (d) rs58231213 in LZTS3, and (e) rs2270968 in MCCC1 was performed in samples from whole blood from PD patients and healthy controls. Heterozygous cDNA samples were measured with five replicates and normalized to the corresponding genomic DNA (gDNA) samples. Columns are presented as the normalized change in Ct between the two alleles (nΔCt). Error bars represent the standard error of the mean. Differences between each sample to the gDNA pool were tested with a Mann–Whitney U test and were considered statistically significant when P ≤ 0.05 as indicated by asterisks. Ct cycle threshold.

