Figure 5.
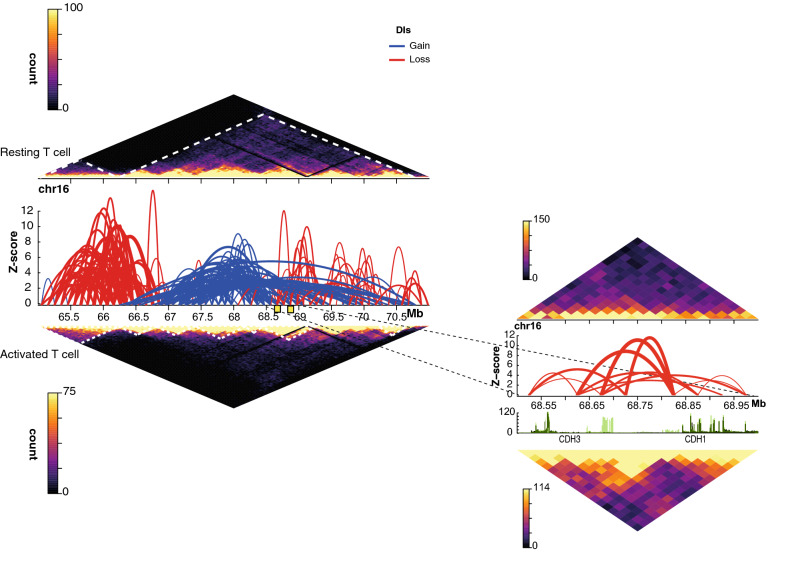
T cell activation results in partitioning of genome topology. In-situ Hi-C contact matrices plotted at 50 kbp resolution in resting and activated T cells over genes that have been associated with T cell activation such as CDH3 and CDH1. Colour scale of contact matrix indicates number of reads per bin pair. Locations of the TADs are marked by white dotted lines as called by TADbit. Significant differential interactions (DIs) as determined by the diffHic pipeline at 100 kbp (FDR < 0.05) are represented by arcs in the centre, where the vertical axis is the z-score (− log10 p-value as calculated by edgeR). Each arc connects the two interacting bins and therefore identifies the relevant bin pair. Red and blue arcs represent strengthened (logFC > 0) and weakened (logFC < 0) DIs, respectively, in response to activation. The zoomed inset regions show in-situ Hi-C contact matrices and DIs at 25 kbp resolution (FDR < 0.05) and RNA sequencing coverage plots at the CDH3 and CDH1 loci. Light and dark green coverage plots represent activated and resting T cells, respectively.

