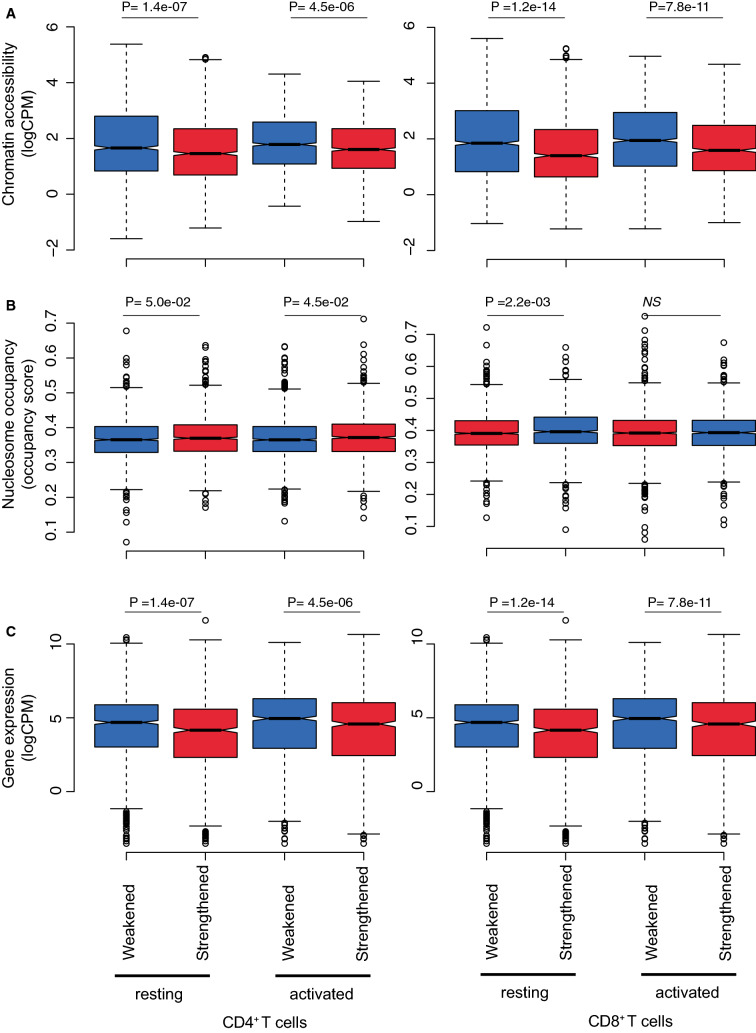
Figure 6.
Increased strength in TAD boundary and chromatin interactions upon T cell activation is associated with nucleosome occupancy and gene expression. Box plots showing the distribution of the average (A) chromatin accessibility (logCPM), (B) nucleosome occupancy (NucleoATAC occupancy score) and (C) expression of protein-coding genes (logCPM) across differential TAD boundaries strengthened and weakened following activation of CD4+ and CD8+ T cells. Shown are the median (central horizontal line), interquartile range (boxes), values of the upper and lower quartiles (whiskers), outliers beyond 1.5 IQR (circles). Statistical comparisons were made with unpaired Wilcoxon tests.

