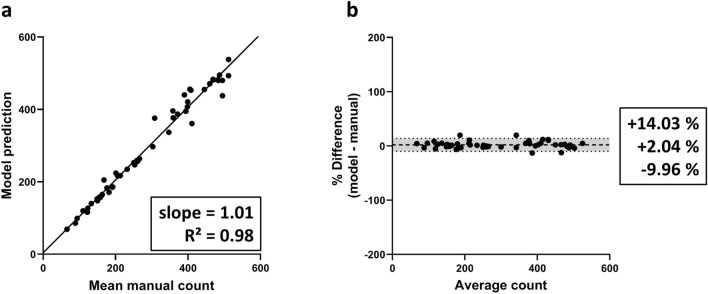
Figure 2.
Linear regression and bias analysis of automated counts on retinal frames. (a) Linear regression analysis for the average of the manual counts versus model output indicates that the automated counts show a very high linear relationship with manual counts. Best-fit linear regression correlation coefficient ( and slope) are indicated. (b) Bland–Altman analysis of the automated counts compared to the operator average, showing mean bias limits of agreement.

