
Fig. 2. Convergence in the vocabularies that emerged in populations of different sizes, for N = 2 (black dots), N = 6 (blue diamonds), N = 8 (purple squares), N = 24 (green triangles), and N = 50 (yellow circles).
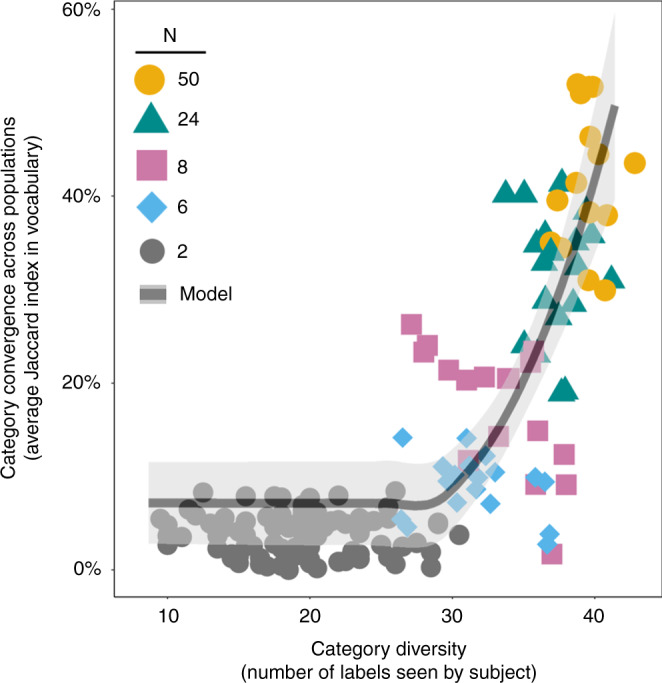
Vertical axis reports the average similarity in vocabulary (average Jaccard Index) between each network trial and all other networks of the same population size. Horizontal axis displays category diversity, measured as the average number of unique labels encountered by subjects in a population. Data points represent experimental results (80 dyads and 15 social networks of each size). Black trend line shows model predictions (averaged over 50 simulated trials; 100 rounds each trial; dmin = 0.01; |L| = 5000; b = 1); see Supplementary Information section 1.2 for model specification (equation S1). The measure of center indicated by the model trend line is the mean Jaccard Index among simulated trials of the same population size, ordered by the average category diversity in each trial (Fig. S1). Error bands show 95% confidence intervals.