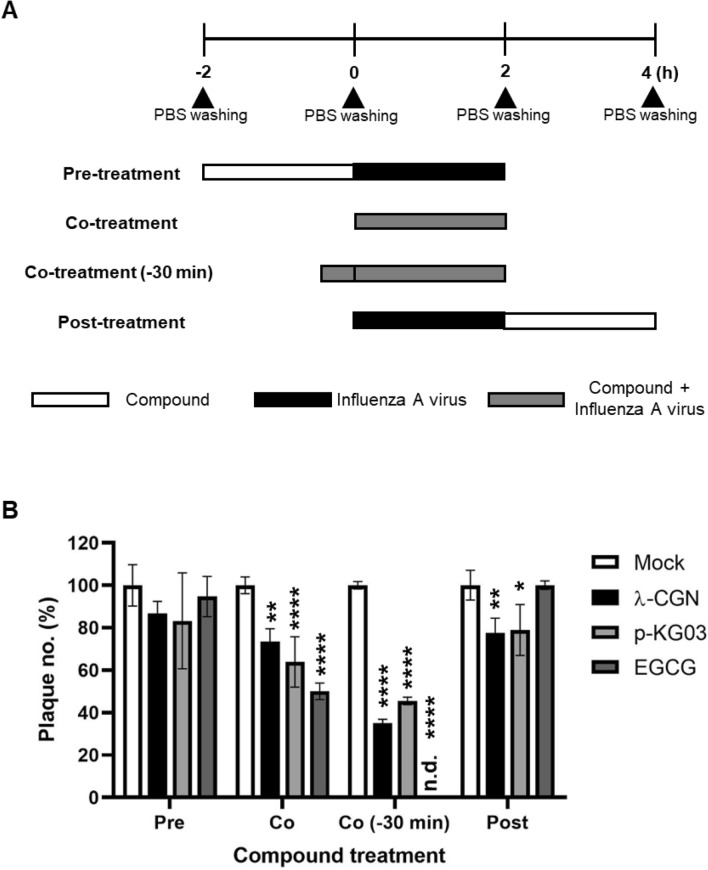
Figure 2.
Time-of-addition experiment. (A) Schematic representation of compound treatment and virus infection. In the pre-treatment assay, MDCK cells were treated with λ-CGN (1 μg/ml) for 2 h and then infected with PR8 at an MOI of 0.001 for additional 2 h. In the co-treatment assay, the mixture of λ-CGN and PR8 was loaded onto the cells immediately or after 30-min-preincubation [Co-treatment (− 30 min)]. In the post-treatment assay, PR8-infected cells were added with λ-CGN for 2 h. As controls, p-KG03 (1 μg/ml) or EGCG (1 μM) was treated in all sets. In each step, cells were washed with PBS to remove non-specifically bound compounds or unabsorbed virus. (B) Plaque titration. The cells treated with compounds and PR8 at different time points were incubated in the overlay medium. At day 3 post-infection, viral plaques were counted in comparison to the mock-treated controls (set at 100%). Data are expressed as the mean ± S.D. of three independent experiments. *P < 0.05; **P < 0.01; ****P < 0.0001; n.d., not detected. Pre, pre-treatment of the compound; Co, co-treatment of the compound with virus; Co (− 30), co-treatment with 30 min-preincubated samples; post, post-treatment of the compound. The graph was created using GraphPad Prism 8.3.1 (www.graphpad.com).

