Figure 6.
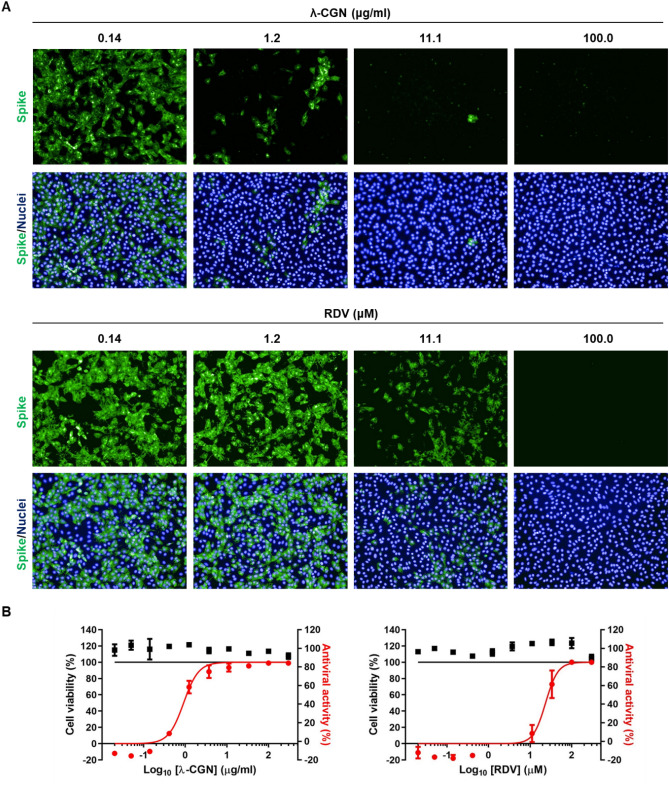
Image-based antiviral analysis of λ-CGN against SARS-CoV-2. (A) Vero cells seeded in 96-well plates were infected with SARS-CoV-2 at an MOI of 0.02, either alone or in the presence of increasing concentrations of λ-CGN (upper panel) or RDV (lower panel; a control). On day 2 post-infection, cells were fixed and permeabilized prior to immunostaining with an anti-SARS-CoV-2 spike antibody and an Alexa Fluor 488-conjugated goat anti-mouse IgG (green). Cell nuclei were counterstained with DAPI to estimate cell viability (blue). Images were captured with a 20× objective lens fitted to an automated fluorescence microscope by using the Harmony High-Content Imaging and Analysis software 3.5.2 (www.perkinelmer.com). (B) The number of fluorescent green and blue spots was counted to calculate antiviral activity (red circles) and cell viability (black squares), respectively, at each concentration of the compounds. The viability of mock-infected cells were fixed as 100%, while the antiviral activity in virus-infected cells or mock-infected cells was fixed as 0 and 100%, respectively. Data are expressed as the mean ± S.D. from three independent experiments. The graphs were created using GraphPad Prism 8.3.1 (www.graphpad.com).

